
 Yahoo Finance
 The Pioneer Credit (ASX:PNC) Share Price Has Gained 52% And Shareholders Are Hoping For More

Want to participate in a short research study? Help shape the future of investing tools and you could win a $250 gift card!
It might be of some concern to shareholders to see the Pioneer Credit Limited (ASX:PNC) share price down 14% in the last month. But that doesn't change the fact that the returns over the last five years have been respectable. The share price is up 52%, which is better than the market return of 45%.
See our latest analysis for Pioneer Credit
To quote Buffett, 'Ships will sail around the world but the Flat Earth Society will flourish. There will continue to be wide discrepancies between price and value in the marketplace...' One way to examine how market sentiment has changed over time is to look at the interaction between a company's share price and its earnings per share (EPS).
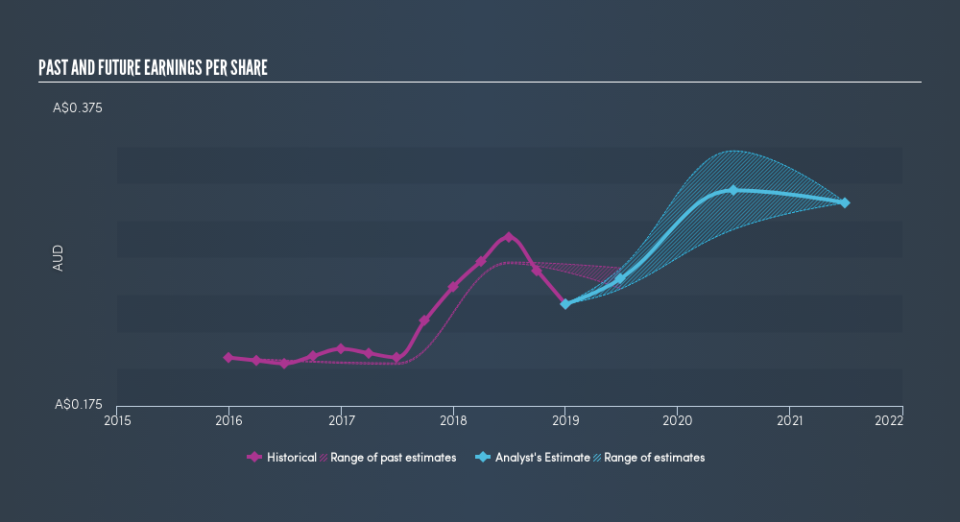
Over half a decade, Pioneer Credit managed to grow its earnings per share at 25% a year. This EPS growth is higher than the 8.7% average annual increase in the share price. So it seems the market isn't so enthusiastic about the stock these days. The reasonably low P/E ratio of 9.64 also suggests market apprehension.
The image below shows how EPS has tracked over time (if you click on the image you can see greater detail).
Before buying or selling a stock, we always recommend a close examination of historic growth trends, available here..
What About Dividends?
It is important to consider the total shareholder return, as well as the share price return, for any given stock. The TSR incorporates the value of any spin-offs or discounted capital raisings, along with any dividends, based on the assumption that the dividends are reinvested. It's fair to say that the TSR gives a more complete picture for stocks that pay a dividend. We note that for Pioneer Credit the TSR over the last 5 years was 90%, which is better than the share price return mentioned above. This is largely a result of its dividend payments!
A Different Perspective
Investors in Pioneer Credit had a tough year, with a total loss of 21% (including dividends), against a market gain of about 12%. However, keep in mind that even the best stocks will sometimes underperform the market over a twelve month period. Longer term investors wouldn't be so upset, since they would have made 14%, each year, over five years. If the fundamental data continues to indicate long term sustainable growth, the current sell-off could be an opportunity worth considering. Keeping this in mind, a solid next step might be to take a look at Pioneer Credit's dividend track record. This free interactive graph is a great place to start.
If you would prefer to check out another company -- one with potentially superior financials -- then do not miss this free list of companies that have proven they can grow earnings.
Please note, the market returns quoted in this article reflect the market weighted average returns of stocks that currently trade on AU exchanges.
We aim to bring you long-term focused research analysis driven by fundamental data. Note that our analysis may not factor in the latest price-sensitive company announcements or qualitative material.
If you spot an error that warrants correction, please contact the editor at editorial-team@simplywallst.com. This article by Simply Wall St is general in nature. It does not constitute a recommendation to buy or sell any stock, and does not take account of your objectives, or your financial situation. Simply Wall St has no position in the stocks mentioned. Thank you for reading.
