
 Yahoo Finance
 A Piece Of The Puzzle Missing From Aeris Resources Limited's (ASX:AIS) Share Price
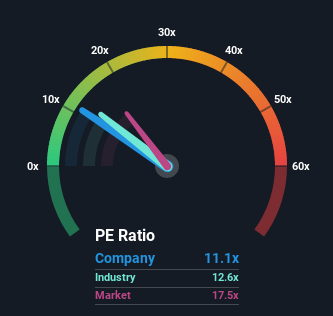
When close to half the companies in Australia have price-to-earnings ratios (or "P/E's") above 18x, you may consider Aeris Resources Limited (ASX:AIS) as an attractive investment with its 11.1x P/E ratio. However, the P/E might be low for a reason and it requires further investigation to determine if it's justified.
Aeris Resources hasn't been tracking well recently as its declining earnings compare poorly to other companies, which have seen some growth on average. The P/E is probably low because investors think this poor earnings performance isn't going to get any better. If this is the case, then existing shareholders will probably struggle to get excited about the future direction of the share price.
Check out our latest analysis for Aeris Resources
If you'd like to see what analysts are forecasting going forward, you should check out our free report on Aeris Resources.
How Is Aeris Resources' Growth Trending?
Aeris Resources' P/E ratio would be typical for a company that's only expected to deliver limited growth, and importantly, perform worse than the market.
If we review the last year of earnings, dishearteningly the company's profits fell to the tune of 52%. This means it has also seen a slide in earnings over the longer-term as EPS is down 93% in total over the last three years. Accordingly, shareholders would have felt downbeat about the medium-term rates of earnings growth.
Turning to the outlook, the next three years should generate growth of 44% per annum as estimated by the one analyst watching the company. With the market only predicted to deliver 13% per year, the company is positioned for a stronger earnings result.
With this information, we find it odd that Aeris Resources is trading at a P/E lower than the market. It looks like most investors are not convinced at all that the company can achieve future growth expectations.
The Final Word
We'd say the price-to-earnings ratio's power isn't primarily as a valuation instrument but rather to gauge current investor sentiment and future expectations.
We've established that Aeris Resources currently trades on a much lower than expected P/E since its forecast growth is higher than the wider market. There could be some major unobserved threats to earnings preventing the P/E ratio from matching the positive outlook. It appears many are indeed anticipating earnings instability, because these conditions should normally provide a boost to the share price.
Before you take the next step, you should know about the 2 warning signs for Aeris Resources that we have uncovered.
Of course, you might also be able to find a better stock than Aeris Resources. So you may wish to see this free collection of other companies that sit on P/E's below 20x and have grown earnings strongly.
Have feedback on this article? Concerned about the content? Get in touch with us directly. Alternatively, email editorial-team (at) simplywallst.com.
This article by Simply Wall St is general in nature. We provide commentary based on historical data and analyst forecasts only using an unbiased methodology and our articles are not intended to be financial advice. It does not constitute a recommendation to buy or sell any stock, and does not take account of your objectives, or your financial situation. We aim to bring you long-term focused analysis driven by fundamental data. Note that our analysis may not factor in the latest price-sensitive company announcements or qualitative material. Simply Wall St has no position in any stocks mentioned.
