
 Yahoo Finance
 Are Philip Morris International Inc.’s (NYSE:PM) High Returns Really That Great?

Today we'll look at Philip Morris International Inc. (NYSE:PM) and reflect on its potential as an investment. In particular, we'll consider its Return On Capital Employed (ROCE), as that can give us insight into how profitably the company is able to employ capital in its business.
Firstly, we'll go over how we calculate ROCE. Then we'll compare its ROCE to similar companies. Last but not least, we'll look at what impact its current liabilities have on its ROCE.
Understanding Return On Capital Employed (ROCE)
ROCE is a measure of a company's yearly pre-tax profit (its return), relative to the capital employed in the business. All else being equal, a better business will have a higher ROCE. Overall, it is a valuable metric that has its flaws. Author Edwin Whiting says to be careful when comparing the ROCE of different businesses, since 'No two businesses are exactly alike.
So, How Do We Calculate ROCE?
The formula for calculating the return on capital employed is:
Return on Capital Employed = Earnings Before Interest and Tax (EBIT) ÷ (Total Assets - Current Liabilities)
Or for Philip Morris International:
0.45 = US$11b ÷ (US$43b - US$19b) (Based on the trailing twelve months to December 2019.)
So, Philip Morris International has an ROCE of 45%.
Check out our latest analysis for Philip Morris International
Does Philip Morris International Have A Good ROCE?
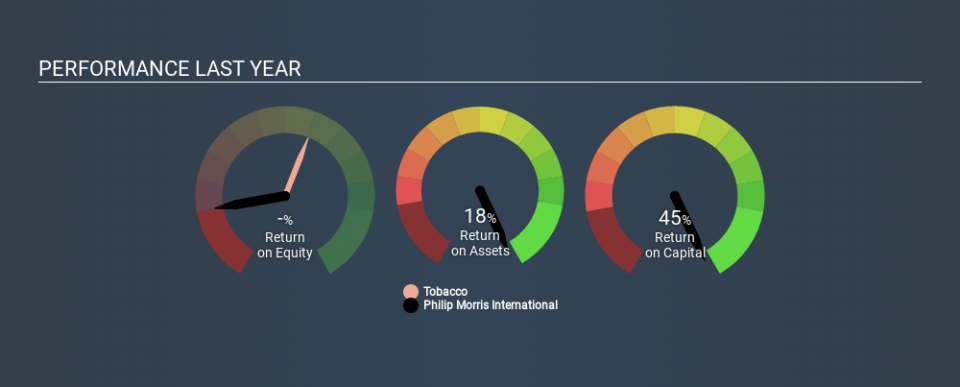
ROCE can be useful when making comparisons, such as between similar companies. Philip Morris International's ROCE appears to be substantially greater than the 19% average in the Tobacco industry. I think that's good to see, since it implies the company is better than other companies at making the most of its capital. Putting aside its position relative to its industry for now, in absolute terms, Philip Morris International's ROCE is currently very good.
The image below shows how Philip Morris International's ROCE compares to its industry, and you can click it to see more detail on its past growth.
When considering this metric, keep in mind that it is backwards looking, and not necessarily predictive. ROCE can be misleading for companies in cyclical industries, with returns looking impressive during the boom times, but very weak during the busts. ROCE is only a point-in-time measure. Since the future is so important for investors, you should check out our free report on analyst forecasts for Philip Morris International.
What Are Current Liabilities, And How Do They Affect Philip Morris International's ROCE?
Short term (or current) liabilities, are things like supplier invoices, overdrafts, or tax bills that need to be paid within 12 months. The ROCE equation subtracts current liabilities from capital employed, so a company with a lot of current liabilities appears to have less capital employed, and a higher ROCE than otherwise. To check the impact of this, we calculate if a company has high current liabilities relative to its total assets.
Philip Morris International has current liabilities of US$19b and total assets of US$43b. As a result, its current liabilities are equal to approximately 44% of its total assets. A medium level of current liabilities boosts Philip Morris International's ROCE somewhat.
Our Take On Philip Morris International's ROCE
Still, it has a high ROCE, and may be an interesting prospect for further research. There might be better investments than Philip Morris International out there, but you will have to work hard to find them . These promising businesses with rapidly growing earnings might be right up your alley.
If you like to buy stocks alongside management, then you might just love this free list of companies. (Hint: insiders have been buying them).
If you spot an error that warrants correction, please contact the editor at editorial-team@simplywallst.com. This article by Simply Wall St is general in nature. It does not constitute a recommendation to buy or sell any stock, and does not take account of your objectives, or your financial situation. Simply Wall St has no position in the stocks mentioned.
We aim to bring you long-term focused research analysis driven by fundamental data. Note that our analysis may not factor in the latest price-sensitive company announcements or qualitative material. Thank you for reading.
