
 Yahoo Finance
 PGG Wrightson's (NZSE:PGW) investors will be pleased with their respectable 55% return over the last year
These days it's easy to simply buy an index fund, and your returns should (roughly) match the market. But you can significantly boost your returns by picking above-average stocks. For example, the PGG Wrightson Limited (NZSE:PGW) share price is up 41% in the last 1 year, clearly besting the market return of around 1.9% (not including dividends). That's a solid performance by our standards! On the other hand, longer term shareholders have had a tougher run, with the stock falling 29% in three years.
So let's assess the underlying fundamentals over the last 1 year and see if they've moved in lock-step with shareholder returns.
See our latest analysis for PGG Wrightson
While the efficient markets hypothesis continues to be taught by some, it has been proven that markets are over-reactive dynamic systems, and investors are not always rational. One imperfect but simple way to consider how the market perception of a company has shifted is to compare the change in the earnings per share (EPS) with the share price movement.
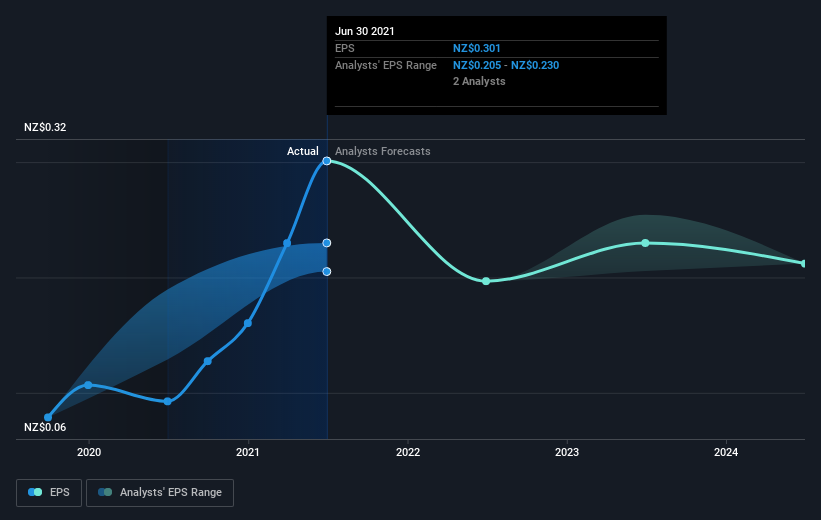
During the last year PGG Wrightson grew its earnings per share (EPS) by 225%. This EPS growth is significantly higher than the 41% increase in the share price. So it seems like the market has cooled on PGG Wrightson, despite the growth. Interesting.
You can see below how EPS has changed over time (discover the exact values by clicking on the image).
We know that PGG Wrightson has improved its bottom line over the last three years, but what does the future have in store? If you are thinking of buying or selling PGG Wrightson stock, you should check out this FREE detailed report on its balance sheet.
What About Dividends?
It is important to consider the total shareholder return, as well as the share price return, for any given stock. The TSR incorporates the value of any spin-offs or discounted capital raisings, along with any dividends, based on the assumption that the dividends are reinvested. So for companies that pay a generous dividend, the TSR is often a lot higher than the share price return. As it happens, PGG Wrightson's TSR for the last 1 year was 55%, which exceeds the share price return mentioned earlier. And there's no prize for guessing that the dividend payments largely explain the divergence!
A Different Perspective
We're pleased to report that PGG Wrightson shareholders have received a total shareholder return of 55% over one year. And that does include the dividend. Since the one-year TSR is better than the five-year TSR (the latter coming in at 22% per year), it would seem that the stock's performance has improved in recent times. Given the share price momentum remains strong, it might be worth taking a closer look at the stock, lest you miss an opportunity. While it is well worth considering the different impacts that market conditions can have on the share price, there are other factors that are even more important. Consider for instance, the ever-present spectre of investment risk. We've identified 3 warning signs with PGG Wrightson (at least 1 which makes us a bit uncomfortable) , and understanding them should be part of your investment process.
If you would prefer to check out another company -- one with potentially superior financials -- then do not miss this free list of companies that have proven they can grow earnings.
Please note, the market returns quoted in this article reflect the market weighted average returns of stocks that currently trade on NZ exchanges.
This article by Simply Wall St is general in nature. We provide commentary based on historical data and analyst forecasts only using an unbiased methodology and our articles are not intended to be financial advice. It does not constitute a recommendation to buy or sell any stock, and does not take account of your objectives, or your financial situation. We aim to bring you long-term focused analysis driven by fundamental data. Note that our analysis may not factor in the latest price-sensitive company announcements or qualitative material. Simply Wall St has no position in any stocks mentioned.
Have feedback on this article? Concerned about the content? Get in touch with us directly. Alternatively, email editorial-team (at) simplywallst.com.
