
 Yahoo Finance
 Pet Valu Holdings (TSE:PET) Looks To Prolong Its Impressive Returns
There are a few key trends to look for if we want to identify the next multi-bagger. Ideally, a business will show two trends; firstly a growing return on capital employed (ROCE) and secondly, an increasing amount of capital employed. This shows us that it's a compounding machine, able to continually reinvest its earnings back into the business and generate higher returns. That's why when we briefly looked at Pet Valu Holdings' (TSE:PET) ROCE trend, we were very happy with what we saw.
What Is Return On Capital Employed (ROCE)?
For those who don't know, ROCE is a measure of a company's yearly pre-tax profit (its return), relative to the capital employed in the business. The formula for this calculation on Pet Valu Holdings is:
Return on Capital Employed = Earnings Before Interest and Tax (EBIT) ÷ (Total Assets - Current Liabilities)
0.24 = CA$159m ÷ (CA$828m - CA$175m) (Based on the trailing twelve months to September 2023).
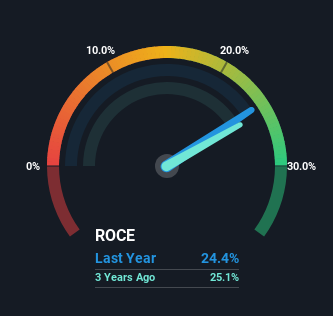
Thus, Pet Valu Holdings has an ROCE of 24%. In absolute terms that's a great return and it's even better than the Specialty Retail industry average of 11%.
View our latest analysis for Pet Valu Holdings
In the above chart we have measured Pet Valu Holdings' prior ROCE against its prior performance, but the future is arguably more important. If you'd like, you can check out the forecasts from the analysts covering Pet Valu Holdings for free.
How Are Returns Trending?
In terms of Pet Valu Holdings' history of ROCE, it's quite impressive. Over the past three years, ROCE has remained relatively flat at around 24% and the business has deployed 61% more capital into its operations. Returns like this are the envy of most businesses and given it has repeatedly reinvested at these rates, that's even better. You'll see this when looking at well operated businesses or favorable business models.
What We Can Learn From Pet Valu Holdings' ROCE
Pet Valu Holdings has demonstrated its proficiency by generating high returns on increasing amounts of capital employed, which we're thrilled about. Yet over the last year the stock has declined 26%, so the decline might provide an opening. For that reason, savvy investors might want to look further into this company in case it's a prime investment.
One more thing to note, we've identified 1 warning sign with Pet Valu Holdings and understanding this should be part of your investment process.
If you want to search for more stocks that have been earning high returns, check out this free list of stocks with solid balance sheets that are also earning high returns on equity.
Have feedback on this article? Concerned about the content? Get in touch with us directly. Alternatively, email editorial-team (at) simplywallst.com.
This article by Simply Wall St is general in nature. We provide commentary based on historical data and analyst forecasts only using an unbiased methodology and our articles are not intended to be financial advice. It does not constitute a recommendation to buy or sell any stock, and does not take account of your objectives, or your financial situation. We aim to bring you long-term focused analysis driven by fundamental data. Note that our analysis may not factor in the latest price-sensitive company announcements or qualitative material. Simply Wall St has no position in any stocks mentioned.
