
 Yahoo Finance
 What Is PerkinElmer's (NYSE:PKI) P/E Ratio After Its Share Price Tanked?

To the annoyance of some shareholders, PerkinElmer (NYSE:PKI) shares are down a considerable 30% in the last month. The recent drop has obliterated the annual return, with the share price now down 30% over that longer period.
All else being equal, a share price drop should make a stock more attractive to potential investors. While the market sentiment towards a stock is very changeable, in the long run, the share price will tend to move in the same direction as earnings per share. The implication here is that long term investors have an opportunity when expectations of a company are too low. Perhaps the simplest way to get a read on investors' expectations of a business is to look at its Price to Earnings Ratio (PE Ratio). A high P/E implies that investors have high expectations of what a company can achieve compared to a company with a low P/E ratio.
Check out our latest analysis for PerkinElmer
How Does PerkinElmer's P/E Ratio Compare To Its Peers?
PerkinElmer's P/E of 32.46 indicates some degree of optimism towards the stock. The image below shows that PerkinElmer has a higher P/E than the average (27.8) P/E for companies in the life sciences industry.
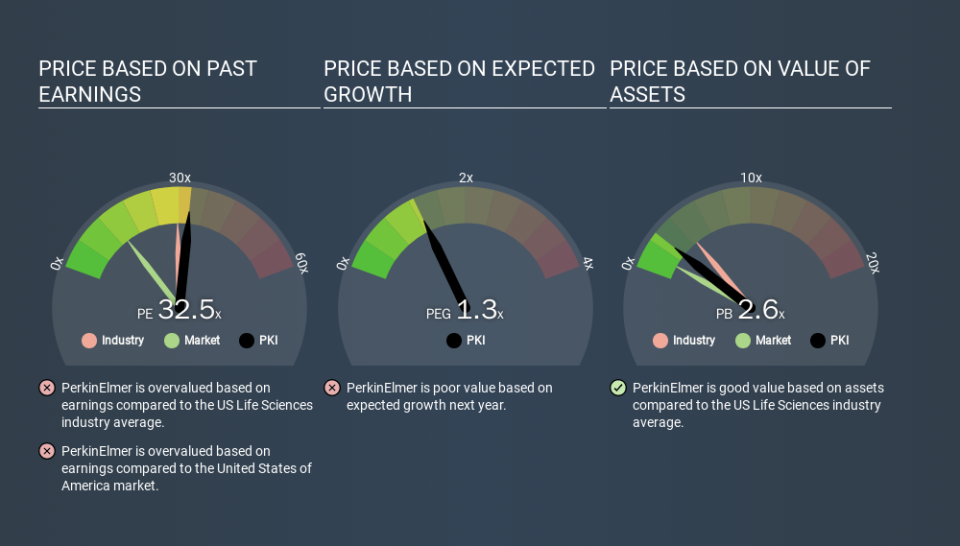
Its relatively high P/E ratio indicates that PerkinElmer shareholders think it will perform better than other companies in its industry classification. Clearly the market expects growth, but it isn't guaranteed. So further research is always essential. I often monitor director buying and selling.
How Growth Rates Impact P/E Ratios
Earnings growth rates have a big influence on P/E ratios. If earnings are growing quickly, then the 'E' in the equation will increase faster than it would otherwise. That means even if the current P/E is high, it will reduce over time if the share price stays flat. Then, a lower P/E should attract more buyers, pushing the share price up.
PerkinElmer's earnings per share fell by 3.8% in the last twelve months. But EPS is up 12% over the last 5 years.
A Limitation: P/E Ratios Ignore Debt and Cash In The Bank
Don't forget that the P/E ratio considers market capitalization. In other words, it does not consider any debt or cash that the company may have on the balance sheet. The exact same company would hypothetically deserve a higher P/E ratio if it had a strong balance sheet, than if it had a weak one with lots of debt, because a cashed up company can spend on growth.
Such spending might be good or bad, overall, but the key point here is that you need to look at debt to understand the P/E ratio in context.
Is Debt Impacting PerkinElmer's P/E?
Net debt is 25% of PerkinElmer's market cap. You'd want to be aware of this fact, but it doesn't bother us.
The Verdict On PerkinElmer's P/E Ratio
PerkinElmer trades on a P/E ratio of 32.5, which is above its market average of 12.7. With a bit of debt, but a lack of recent growth, it's safe to say the market is expecting improved profit performance from the company, in the next few years. What can be absolutely certain is that the market has become significantly less optimistic about PerkinElmer over the last month, with the P/E ratio falling from 46.5 back then to 32.5 today. For those who don't like to trade against momentum, that could be a warning sign, but a contrarian investor might want to take a closer look.
Investors have an opportunity when market expectations about a stock are wrong. People often underestimate remarkable growth -- so investors can make money when fast growth is not fully appreciated. So this free visual report on analyst forecasts could hold the key to an excellent investment decision.
Of course you might be able to find a better stock than PerkinElmer. So you may wish to see this free collection of other companies that have grown earnings strongly.
If you spot an error that warrants correction, please contact the editor at editorial-team@simplywallst.com. This article by Simply Wall St is general in nature. It does not constitute a recommendation to buy or sell any stock, and does not take account of your objectives, or your financial situation. Simply Wall St has no position in the stocks mentioned.
We aim to bring you long-term focused research analysis driven by fundamental data. Note that our analysis may not factor in the latest price-sensitive company announcements or qualitative material. Thank you for reading.
