
 Yahoo Finance
 Performance Shipping (NASDAQ:PSHG) Is Achieving High Returns On Its Capital
There are a few key trends to look for if we want to identify the next multi-bagger. Typically, we'll want to notice a trend of growing return on capital employed (ROCE) and alongside that, an expanding base of capital employed. Ultimately, this demonstrates that it's a business that is reinvesting profits at increasing rates of return. And in light of that, the trends we're seeing at Performance Shipping's (NASDAQ:PSHG) look very promising so lets take a look.
Return On Capital Employed (ROCE): What Is It?
Just to clarify if you're unsure, ROCE is a metric for evaluating how much pre-tax income (in percentage terms) a company earns on the capital invested in its business. The formula for this calculation on Performance Shipping is:
Return on Capital Employed = Earnings Before Interest and Tax (EBIT) ÷ (Total Assets - Current Liabilities)
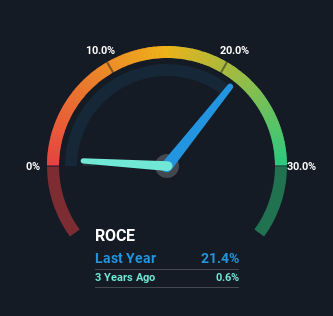
0.21 = US$65m ÷ (US$326m - US$22m) (Based on the trailing twelve months to June 2023).
Thus, Performance Shipping has an ROCE of 21%. That's a fantastic return and not only that, it outpaces the average of 10% earned by companies in a similar industry.
See our latest analysis for Performance Shipping
Above you can see how the current ROCE for Performance Shipping compares to its prior returns on capital, but there's only so much you can tell from the past. If you'd like to see what analysts are forecasting going forward, you should check out our free report for Performance Shipping.
What Does the ROCE Trend For Performance Shipping Tell Us?
Performance Shipping has recently broken into profitability so their prior investments seem to be paying off. The company was generating losses five years ago, but now it's earning 21% which is a sight for sore eyes. In addition to that, Performance Shipping is employing 212% more capital than previously which is expected of a company that's trying to break into profitability. This can indicate that there's plenty of opportunities to invest capital internally and at ever higher rates, both common traits of a multi-bagger.
On a related note, the company's ratio of current liabilities to total assets has decreased to 6.9%, which basically reduces it's funding from the likes of short-term creditors or suppliers. So shareholders would be pleased that the growth in returns has mostly come from underlying business performance.
The Bottom Line
To the delight of most shareholders, Performance Shipping has now broken into profitability. And since the stock has dived 99% over the last five years, there may be other factors affecting the company's prospects. Regardless, we think the underlying fundamentals warrant this stock for further investigation.
If you'd like to know more about Performance Shipping, we've spotted 4 warning signs, and 3 of them are potentially serious.
Performance Shipping is not the only stock earning high returns. If you'd like to see more, check out our free list of companies earning high returns on equity with solid fundamentals.
Have feedback on this article? Concerned about the content? Get in touch with us directly. Alternatively, email editorial-team (at) simplywallst.com.
This article by Simply Wall St is general in nature. We provide commentary based on historical data and analyst forecasts only using an unbiased methodology and our articles are not intended to be financial advice. It does not constitute a recommendation to buy or sell any stock, and does not take account of your objectives, or your financial situation. We aim to bring you long-term focused analysis driven by fundamental data. Note that our analysis may not factor in the latest price-sensitive company announcements or qualitative material. Simply Wall St has no position in any stocks mentioned.
