Pending Long USD/JPY, Using Nikkei 225 as Confirmation
DailyFX.com -
Position: Long USD/JPY
Entry #1: 114.95
Entry #2: 115.62
Target: 118.66 (+371-pips on entry #1, +304-pips on entry #2; average +337.5)
Stop: 114.00 (-95-pips maximum; trail below daily 13-EMA)
Reward/Risk Ratio: 337.5/95 = 3.55
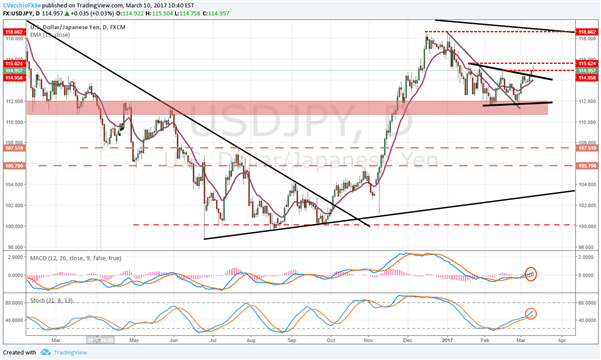
Chart 1: USD/JPY Daily Timeframe (November 2016 to March 2017)

Chart 2: USD/JPY Daily Time Frame (March 2016 to March 2017)

USD/JPY appears to be trying to put in a base above an area that has provided both support and resistance over the past 14-months, between 110.50 and 112.00. This basing has taken the form of a symmetrical triangle, which has started to show signs of breaking out to the topside. The swing levels in triangle to watch are 114.95 and 115.62. Closes through these levels will increase confidence in a return back to the yearly highs set near 118.66. Risk is easy to define using the daily 13-EMA, which price has tested but not closed below since February 28. Currently, the daily 13-EMA is 114.00, where stops can be trailed to.
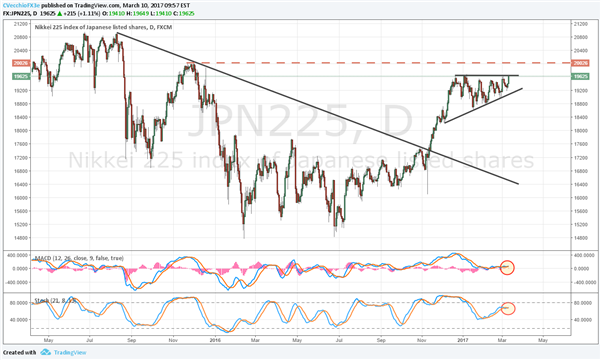
One way to increase confidence in the long USD/JPY position would be to look towards confirmation in the main Japanese stock index, the Nikkei 225. Historically, the Nikkei 225 performs best when the Japanese Yen is weakening. The ascending triangle in place in the Nikkei 225 can be used as a litmus test to confirm that USD/JPY will be moving higher. A break above 19676 would increase our confidence in a USD/JPY breakout back towards 118.66. (See Currency Strategist Michael Boutros’ indepth look at the Nikkei 225.)
Chart 3: Nikkei 225 Daily Timeframe (November 2016 to March 2017)

Chart 4: Nikkei 225 Daily Timeframe (April 2016 to March 2017)

Read more: February US NFPs Surge, but US Dollar Walks Away Disappointed
--- Written by Christopher Vecchio, Senior Currency Strategist
To contact Christopher Vecchio, e-mail cvecchio@dailyfx.com
Follow him on Twitter at @CVecchioFX
To be added to Christopher's e-mail distribution list, please fill out this form
DailyFX provides forex news and technical analysis on the trends that influence the global currency markets.
Learn forex trading with a free practice account and trading charts from IG.

 Yahoo Finance
