
 Yahoo Finance
 The past year for Wesfarmers (ASX:WES) investors has not been profitable
It's easy to match the overall market return by buying an index fund. While individual stocks can be big winners, plenty more fail to generate satisfactory returns. Investors in Wesfarmers Limited (ASX:WES) have tasted that bitter downside in the last year, as the share price dropped 22%. That contrasts poorly with the market decline of 3.7%. On the bright side, the stock is actually up 12% in the last three years.
Since shareholders are down over the longer term, lets look at the underlying fundamentals over the that time and see if they've been consistent with returns.
See our latest analysis for Wesfarmers
While markets are a powerful pricing mechanism, share prices reflect investor sentiment, not just underlying business performance. One imperfect but simple way to consider how the market perception of a company has shifted is to compare the change in the earnings per share (EPS) with the share price movement.
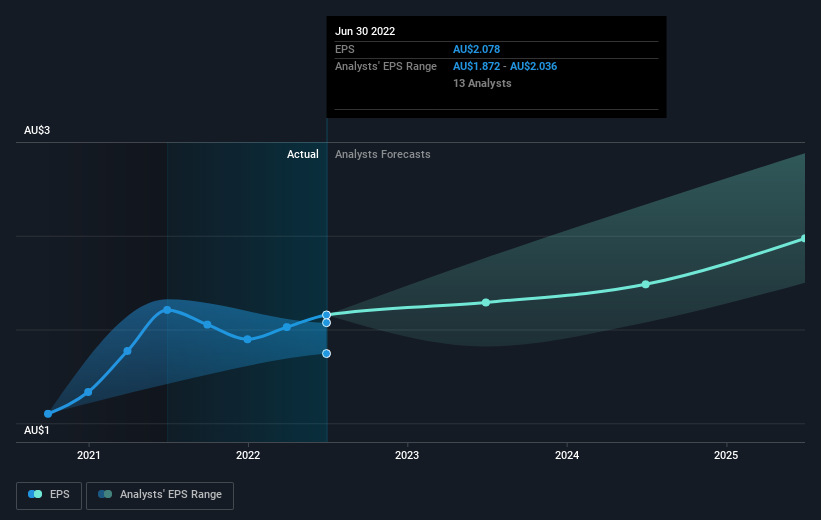
Unfortunately Wesfarmers reported an EPS drop of 1.3% for the last year. This reduction in EPS is not as bad as the 22% share price fall. This suggests the EPS fall has made some shareholders are more nervous about the business.
The image below shows how EPS has tracked over time (if you click on the image you can see greater detail).
We like that insiders have been buying shares in the last twelve months. Having said that, most people consider earnings and revenue growth trends to be a more meaningful guide to the business. Dive deeper into the earnings by checking this interactive graph of Wesfarmers' earnings, revenue and cash flow.
What About Dividends?
As well as measuring the share price return, investors should also consider the total shareholder return (TSR). The TSR incorporates the value of any spin-offs or discounted capital raisings, along with any dividends, based on the assumption that the dividends are reinvested. So for companies that pay a generous dividend, the TSR is often a lot higher than the share price return. In the case of Wesfarmers, it has a TSR of -16% for the last 1 year. That exceeds its share price return that we previously mentioned. And there's no prize for guessing that the dividend payments largely explain the divergence!
A Different Perspective
We regret to report that Wesfarmers shareholders are down 16% for the year (even including dividends). Unfortunately, that's worse than the broader market decline of 3.7%. Having said that, it's inevitable that some stocks will be oversold in a falling market. The key is to keep your eyes on the fundamental developments. On the bright side, long term shareholders have made money, with a gain of 15% per year over half a decade. If the fundamental data continues to indicate long term sustainable growth, the current sell-off could be an opportunity worth considering. While it is well worth considering the different impacts that market conditions can have on the share price, there are other factors that are even more important. Even so, be aware that Wesfarmers is showing 2 warning signs in our investment analysis , you should know about...
There are plenty of other companies that have insiders buying up shares. You probably do not want to miss this free list of growing companies that insiders are buying.
Please note, the market returns quoted in this article reflect the market weighted average returns of stocks that currently trade on AU exchanges.
Have feedback on this article? Concerned about the content? Get in touch with us directly. Alternatively, email editorial-team (at) simplywallst.com.
This article by Simply Wall St is general in nature. We provide commentary based on historical data and analyst forecasts only using an unbiased methodology and our articles are not intended to be financial advice. It does not constitute a recommendation to buy or sell any stock, and does not take account of your objectives, or your financial situation. We aim to bring you long-term focused analysis driven by fundamental data. Note that our analysis may not factor in the latest price-sensitive company announcements or qualitative material. Simply Wall St has no position in any stocks mentioned.
Join A Paid User Research Session
You’ll receive a US$30 Amazon Gift card for 1 hour of your time while helping us build better investing tools for the individual investors like yourself. Sign up here
