
 Yahoo Finance
 The past three years for Strix Group (LON:KETL) investors has not been profitable
Strix Group Plc (LON:KETL) shareholders should be happy to see the share price up 14% in the last month. But that is meagre solace in the face of the shocking decline over three years. The share price has sunk like a leaky ship, down 75% in that time. So it sure is nice to see a bit of an improvement. Of course the real question is whether the business can sustain a turnaround.
Now let's have a look at the company's fundamentals, and see if the long term shareholder return has matched the performance of the underlying business.
See our latest analysis for Strix Group
While markets are a powerful pricing mechanism, share prices reflect investor sentiment, not just underlying business performance. One imperfect but simple way to consider how the market perception of a company has shifted is to compare the change in the earnings per share (EPS) with the share price movement.
Strix Group saw its EPS decline at a compound rate of 15% per year, over the last three years. The share price decline of 37% is actually steeper than the EPS slippage. So it's likely that the EPS decline has disappointed the market, leaving investors hesitant to buy. This increased caution is also evident in the rather low P/E ratio, which is sitting at 9.91.
The image below shows how EPS has tracked over time (if you click on the image you can see greater detail).
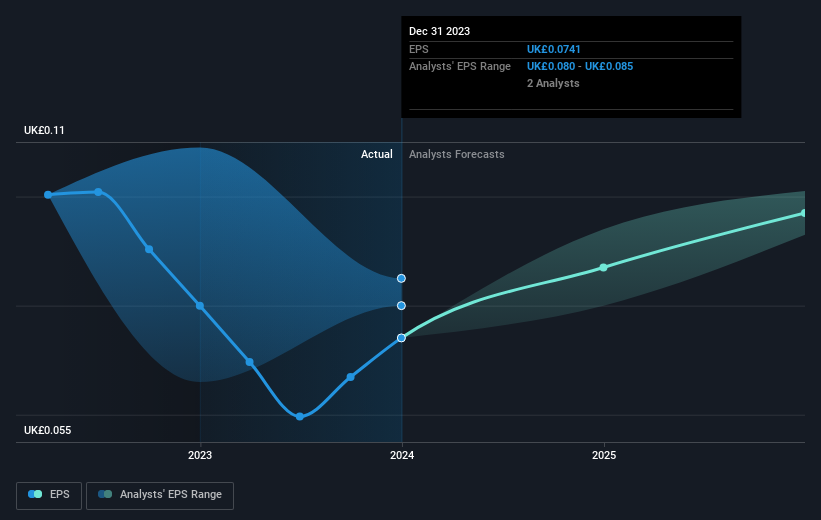
It might be well worthwhile taking a look at our free report on Strix Group's earnings, revenue and cash flow.
What About The Total Shareholder Return (TSR)?
We've already covered Strix Group's share price action, but we should also mention its total shareholder return (TSR). The TSR is a return calculation that accounts for the value of cash dividends (assuming that any dividend received was reinvested) and the calculated value of any discounted capital raisings and spin-offs. Dividends have been really beneficial for Strix Group shareholders, and that cash payout explains why its total shareholder loss of 71%, over the last 3 years, isn't as bad as the share price return.
A Different Perspective
Strix Group shareholders are down 20% for the year, but the market itself is up 2.0%. However, keep in mind that even the best stocks will sometimes underperform the market over a twelve month period. Regrettably, last year's performance caps off a bad run, with the shareholders facing a total loss of 8% per year over five years. We realise that Baron Rothschild has said investors should "buy when there is blood on the streets", but we caution that investors should first be sure they are buying a high quality business. While it is well worth considering the different impacts that market conditions can have on the share price, there are other factors that are even more important. For instance, we've identified 1 warning sign for Strix Group that you should be aware of.
Of course, you might find a fantastic investment by looking elsewhere. So take a peek at this free list of companies we expect will grow earnings.
Please note, the market returns quoted in this article reflect the market weighted average returns of stocks that currently trade on British exchanges.
Have feedback on this article? Concerned about the content? Get in touch with us directly. Alternatively, email editorial-team (at) simplywallst.com.
This article by Simply Wall St is general in nature. We provide commentary based on historical data and analyst forecasts only using an unbiased methodology and our articles are not intended to be financial advice. It does not constitute a recommendation to buy or sell any stock, and does not take account of your objectives, or your financial situation. We aim to bring you long-term focused analysis driven by fundamental data. Note that our analysis may not factor in the latest price-sensitive company announcements or qualitative material. Simply Wall St has no position in any stocks mentioned.
