
 Yahoo Finance
 The past year for MAAS Group Holdings (ASX:MGH) investors has not been profitable
It's easy to match the overall market return by buying an index fund. While individual stocks can be big winners, plenty more fail to generate satisfactory returns. That downside risk was realized by MAAS Group Holdings Limited (ASX:MGH) shareholders over the last year, as the share price declined 28%. That's disappointing when you consider the market declined 4.5%. MAAS Group Holdings may have better days ahead, of course; we've only looked at a one year period.
With that in mind, it's worth seeing if the company's underlying fundamentals have been the driver of long term performance, or if there are some discrepancies.
See our latest analysis for MAAS Group Holdings
To paraphrase Benjamin Graham: Over the short term the market is a voting machine, but over the long term it's a weighing machine. One flawed but reasonable way to assess how sentiment around a company has changed is to compare the earnings per share (EPS) with the share price.
During the unfortunate twelve months during which the MAAS Group Holdings share price fell, it actually saw its earnings per share (EPS) improve by 49%. Of course, the situation might betray previous over-optimism about growth.
It's fair to say that the share price does not seem to be reflecting the EPS growth. So it's easy to justify a look at some other metrics.
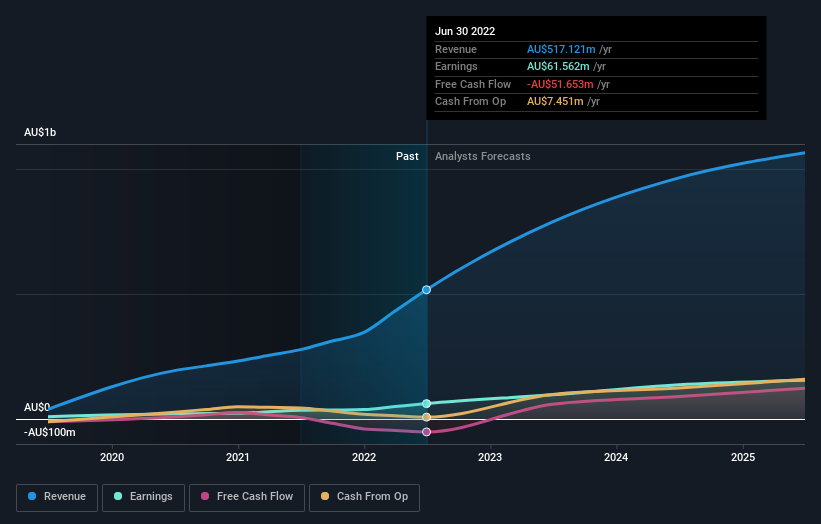
Given the yield is quite low, at 1.4%, we doubt the dividend can shed much light on the share price. MAAS Group Holdings' revenue is actually up 86% over the last year. Since we can't easily explain the share price movement based on these metrics, it might be worth considering how market sentiment has changed towards the stock.
The company's revenue and earnings (over time) are depicted in the image below (click to see the exact numbers).
We consider it positive that insiders have made significant purchases in the last year. Having said that, most people consider earnings and revenue growth trends to be a more meaningful guide to the business. So we recommend checking out this free report showing consensus forecasts
A Different Perspective
MAAS Group Holdings shareholders are down 27% for the year (even including dividends), even worse than the market loss of 4.5%. That's disappointing, but it's worth keeping in mind that the market-wide selling wouldn't have helped. With the stock down 6.2% over the last three months, the market doesn't seem to believe that the company has solved all its problems. Given the relatively short history of this stock, we'd remain pretty wary until we see some strong business performance. While it is well worth considering the different impacts that market conditions can have on the share price, there are other factors that are even more important. Even so, be aware that MAAS Group Holdings is showing 3 warning signs in our investment analysis , and 2 of those make us uncomfortable...
MAAS Group Holdings is not the only stock insiders are buying. So take a peek at this free list of growing companies with insider buying.
Please note, the market returns quoted in this article reflect the market weighted average returns of stocks that currently trade on AU exchanges.
Have feedback on this article? Concerned about the content? Get in touch with us directly. Alternatively, email editorial-team (at) simplywallst.com.
This article by Simply Wall St is general in nature. We provide commentary based on historical data and analyst forecasts only using an unbiased methodology and our articles are not intended to be financial advice. It does not constitute a recommendation to buy or sell any stock, and does not take account of your objectives, or your financial situation. We aim to bring you long-term focused analysis driven by fundamental data. Note that our analysis may not factor in the latest price-sensitive company announcements or qualitative material. Simply Wall St has no position in any stocks mentioned.
Join A Paid User Research Session
You’ll receive a US$30 Amazon Gift card for 1 hour of your time while helping us build better investing tools for the individual investors like yourself. Sign up here
