
 Yahoo Finance
 The past year for HMC Capital (ASX:HMC) investors has not been profitable
The simplest way to benefit from a rising market is to buy an index fund. When you buy individual stocks, you can make higher profits, but you also face the risk of under-performance. Unfortunately the HMC Capital Limited (ASX:HMC) share price slid 39% over twelve months. That contrasts poorly with the market return of 7.3%. Longer term investors have fared much better, since the share price is up 13% in three years. Unfortunately the share price momentum is still quite negative, with prices down 18% in thirty days. Importantly, this could be a market reaction to the recently released financial results. You can check out the latest numbers in our company report.
With that in mind, it's worth seeing if the company's underlying fundamentals have been the driver of long term performance, or if there are some discrepancies.
View our latest analysis for HMC Capital
While the efficient markets hypothesis continues to be taught by some, it has been proven that markets are over-reactive dynamic systems, and investors are not always rational. By comparing earnings per share (EPS) and share price changes over time, we can get a feel for how investor attitudes to a company have morphed over time.
HMC Capital managed to increase earnings per share from a loss to a profit, over the last 12 months.
When a company has just transitioned to profitability, earnings per share growth is not always the best way to look at the share price action. But we may find different metrics more enlightening.
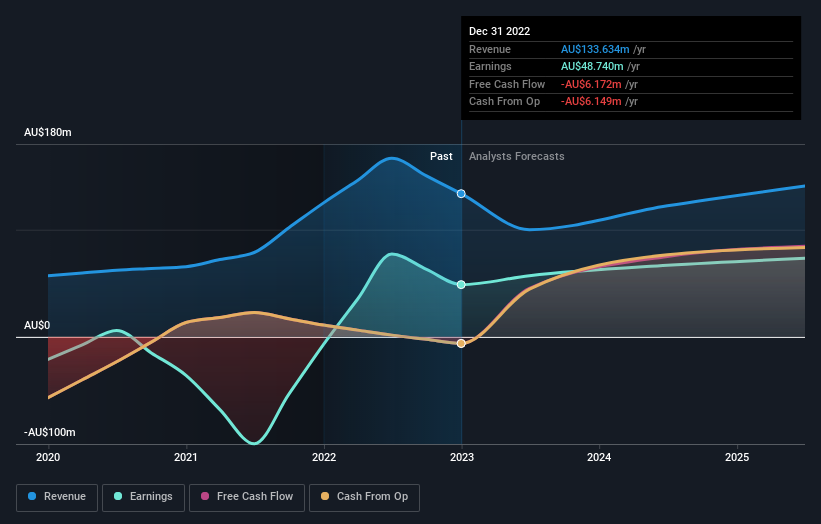
HMC Capital's revenue is actually up 6.9% over the last year. Since we can't easily explain the share price movement based on these metrics, it might be worth considering how market sentiment has changed towards the stock.
The company's revenue and earnings (over time) are depicted in the image below (click to see the exact numbers).
We know that HMC Capital has improved its bottom line over the last three years, but what does the future have in store? You can see how its balance sheet has strengthened (or weakened) over time in this free interactive graphic.
A Different Perspective
The last twelve months weren't great for HMC Capital shares, which cost holders 38%, including dividends, while the market was up about 7.3%. Of course the long term matters more than the short term, and even great stocks will sometimes have a poor year. Investors are up over three years, booking 7% per year, much better than the more recent returns. The recent sell-off could be an opportunity if the business remains sound, so it may be worth checking the fundamental data for signs of a long-term growth trend. I find it very interesting to look at share price over the long term as a proxy for business performance. But to truly gain insight, we need to consider other information, too. Even so, be aware that HMC Capital is showing 2 warning signs in our investment analysis , you should know about...
But note: HMC Capital may not be the best stock to buy. So take a peek at this free list of interesting companies with past earnings growth (and further growth forecast).
Please note, the market returns quoted in this article reflect the market weighted average returns of stocks that currently trade on AU exchanges.
Have feedback on this article? Concerned about the content? Get in touch with us directly. Alternatively, email editorial-team (at) simplywallst.com.
This article by Simply Wall St is general in nature. We provide commentary based on historical data and analyst forecasts only using an unbiased methodology and our articles are not intended to be financial advice. It does not constitute a recommendation to buy or sell any stock, and does not take account of your objectives, or your financial situation. We aim to bring you long-term focused analysis driven by fundamental data. Note that our analysis may not factor in the latest price-sensitive company announcements or qualitative material. Simply Wall St has no position in any stocks mentioned.
Join A Paid User Research Session
You’ll receive a US$30 Amazon Gift card for 1 hour of your time while helping us build better investing tools for the individual investors like yourself. Sign up here
