
 Yahoo Finance
 Paramount Global (PARA) Q1 Earnings Beat, Revenues Rise Y/Y
Paramount Global PARA delivered adjusted earnings of 62 cents per share for the first quarter of 2024, which beat the Zacks Consensus Estimate by 82.35% and increased from 9 cents reported in the year-ago quarter.
Revenues of $7.68 billion beat the Zacks Consensus Estimate by 0.1%. The figure rose 5.8% year over year, owing to an increase in Direct-to-Consumer (DTC), TV Media and Filmed Entertainment revenues.
Adjusted OIBDA surged 80% from the year-ago quarter’s level to $987 million.
Selling, general and administrative expenses decreased 5.2% year over year to $1.66 billion.
Paramount Global Price, Consensus and EPS Surprise
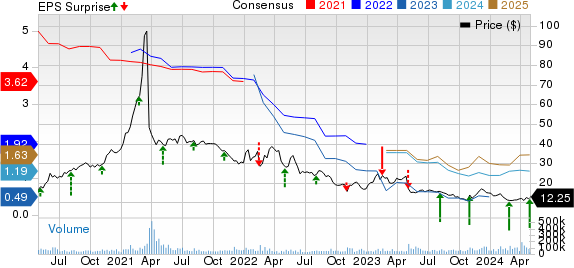
Paramount Global price-consensus-eps-surprise-chart | Paramount Global Quote
Revenues by Type
Advertising revenues (40.3% of total revenues) of $3.09 billion jumped 16.8% year over year. Affiliate revenues (43.7% of total revenues) of $3.35 billion rose 5.6% year over year. Theatrical revenues (2% of total revenues) totaled $153 million in the reported quarter, which climbed 20% year over year. Content-licensing revenues (14% of total revenues) of $1.07 billion plunged 17.5% year over year.
Segment Details
DTC Details
DTC revenues jumped 24% year over year to $1.87 billion, driven by subscriber growth and improvements in engagement and monetization. DTC subscription revenues climbed 22% year over year to $1.35 billion, driven by subscriber growth and increased pricing for Paramount+.
Paramount+ revenues rallied 51%, driven by subscriber growth and ARPU expansion. Paramount+ subscribers reached approximately 71 million, with 3.7 million additions in the quarter. The company witnessed 26% growth in total viewing hours across Paramount+ and Pluto.
DTC advertising revenues increased 31% year over year to $520 million, driven by growth from Pluto TV and Paramount+, including the benefit of Super Bowl LVIII.
The company reported an adjusted OIBDA loss of $286 million, primarily due to an improvement in Paramount+ domestic profitability.
TV Media Details
TV Media revenues rose 1% year over year to $5.23 billion. Advertising revenues increased 14% year over year to $2.58 billion. It reflected a 23-percentage point benefit from CBS’ broadcast of Super Bowl LVIII.
Affiliate and subscription revenues of $1.99 billion declined 3% year over year, primarily due to a fall in subscribers, partially offset by increased pricing. Licensing and other revenues plunged 25% year over year to $651 million, including the impact of 2023 labor strikes on content available for licensing.
TV Media’s adjusted OIBDA increased 11% year over year to $1.44 billion.
Filmed Entertainment Details
Filmed Entertainment revenues rose 3% year over year to $605 million, as Theatrical revenues jumped 20% year over year to $153 million.
Licensing revenues were $451 million, down 1% year over year. Advertising revenues plunged 80% year over year to $1 million.
The company reported an adjusted OIBDA loss of $3 million, narrower than a loss of $99 million in the year-ago period.
Balance Sheet
As of Mar 31, 2024, Paramount Global had cash and cash equivalents of $2.38 billion compared with $2.46 billion as of Dec 31, 2023. Total debt, as of Mar 31, 2024, was $14.6 billion, which remained unchanged sequentially.
Zacks Rank & Stocks to Consider
Paramount Global currently carries a Zacks Rank #3 (Hold).
Some better-ranked stocks in the Consumer Discretionary sector are Disney DIS, Reynolds Consumer Products REYN and Roblox RBLX, each carrying a Zacks Rank #2 (Buy) at present. You can see the complete list of today’s Zacks #1 Rank (Strong Buy) stocks here.
Shares of Disney have jumped 26.2% year to date. DIS is set to report second-quarter fiscal 2024 results on May 7.
Shares of Reynolds Consumer Products have gained 7% year to date. REYN is slated to report first-quarter 2024 results on May 8.
Shares of Roblox have plunged 23.5% year to date. RBLX is set to report first-quarter 2024 results on May 9.
Want the latest recommendations from Zacks Investment Research? Today, you can download 7 Best Stocks for the Next 30 Days. Click to get this free report
The Walt Disney Company (DIS) : Free Stock Analysis Report
Reynolds Consumer Products Inc. (REYN) : Free Stock Analysis Report
Roblox Corporation (RBLX) : Free Stock Analysis Report
Paramount Global (PARA) : Free Stock Analysis Report
