
 Yahoo Finance
 Here’s How P/E Ratios Can Help Us Understand Excelsior Capital Limited (ASX:ECL)

Want to participate in a short research study? Help shape the future of investing tools and you could win a $250 gift card!
The goal of this article is to teach you how to use price to earnings ratios (P/E ratios). We’ll show how you can use Excelsior Capital Limited’s (ASX:ECL) P/E ratio to inform your assessment of the investment opportunity. Based on the last twelve months, Excelsior Capital’s P/E ratio is 10.49. That corresponds to an earnings yield of approximately 9.5%.
See our latest analysis for Excelsior Capital
How Do I Calculate A Price To Earnings Ratio?
The formula for price to earnings is:
Price to Earnings Ratio = Price per Share ÷ Earnings per Share (EPS)
Or for Excelsior Capital:
P/E of 10.49 = A$1.42 ÷ A$0.14 (Based on the year to June 2018.)
Is A High P/E Ratio Good?
A higher P/E ratio implies that investors pay a higher price for the earning power of the business. That isn’t necessarily good or bad, but a high P/E implies relatively high expectations of what a company can achieve in the future.
How Growth Rates Impact P/E Ratios
When earnings fall, the ‘E’ decreases, over time. That means unless the share price falls, the P/E will increase in a few years. So while a stock may look cheap based on past earnings, it could be expensive based on future earnings.
Excelsior Capital increased earnings per share by a whopping 64% last year. Unfortunately, earnings per share are down 17% a year, over 5 years.
How Does Excelsior Capital’s P/E Ratio Compare To Its Peers?
The P/E ratio indicates whether the market has higher or lower expectations of a company. If you look at the image below, you can see Excelsior Capital has a lower P/E than the average (15.3) in the electrical industry classification.
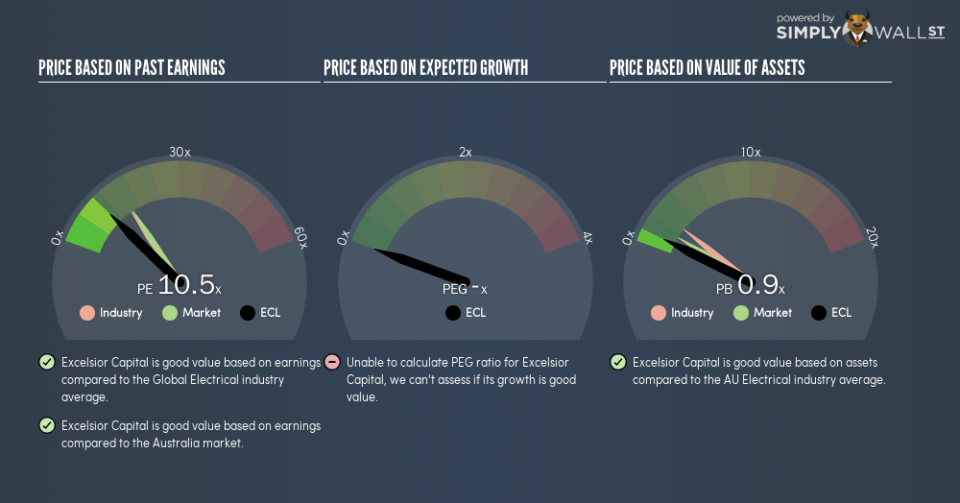
Excelsior Capital’s P/E tells us that market participants think it will not fare as well as its peers in the same industry. Since the market seems unimpressed with Excelsior Capital, it’s quite possible it could surprise on the upside. It is arguably worth checking if insiders are buying shares, because that might imply they believe the stock is undervalued.
A Limitation: P/E Ratios Ignore Debt and Cash In The Bank
The ‘Price’ in P/E reflects the market capitalization of the company. Thus, the metric does not reflect cash or debt held by the company. Hypothetically, a company could reduce its future P/E ratio by spending its cash (or taking on debt) to achieve higher earnings.
Spending on growth might be good or bad a few years later, but the point is that the P/E ratio does not account for the option (or lack thereof).
Excelsior Capital’s Balance Sheet
Since Excelsior Capital holds net cash of AU$19m, it can spend on growth, justifying a higher P/E ratio than otherwise.
The Bottom Line On Excelsior Capital’s P/E Ratio
Excelsior Capital trades on a P/E ratio of 10.5, which is below the AU market average of 15.8. Not only should the net cash position reduce risk, but the recent growth has been impressive. The relatively low P/E ratio implies the market is pessimistic.
Investors have an opportunity when market expectations about a stock are wrong. If it is underestimating a company, investors can make money by buying and holding the shares until the market corrects itself. We don’t have analyst forecasts, but you could get a better understanding of its growth by checking out this more detailed historical graph of earnings, revenue and cash flow.
Of course, you might find a fantastic investment by looking at a few good candidates. So take a peek at this free list of companies with modest (or no) debt, trading on a P/E below 20.
To help readers see past the short term volatility of the financial market, we aim to bring you a long-term focused research analysis purely driven by fundamental data. Note that our analysis does not factor in the latest price-sensitive company announcements.
The author is an independent contributor and at the time of publication had no position in the stocks mentioned. For errors that warrant correction please contact the editor at editorial-team@simplywallst.com.