
 Yahoo Finance
 S&P 500 Tech Update: Short-term Trend Structure Bullish
DailyFX.com -
What’s inside:
The S&P 500 continues to push higher, but…
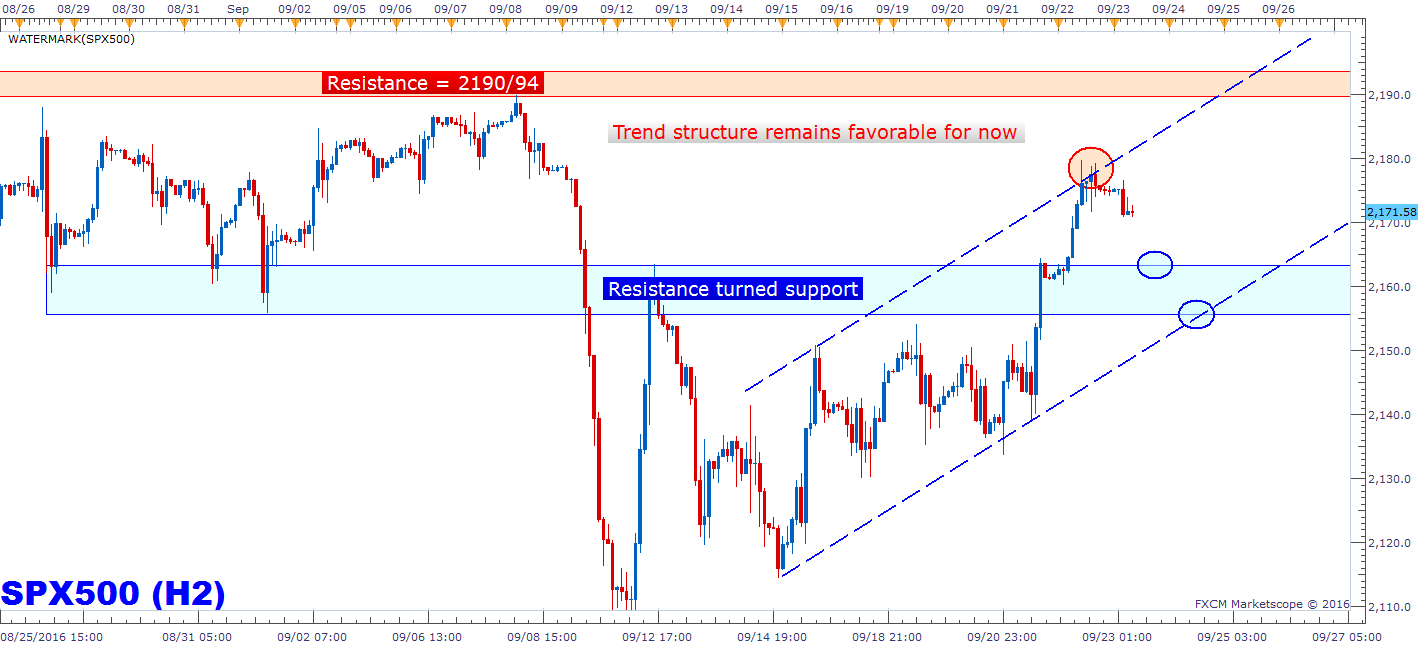
Finds sellers at channel resistance
Remaining in the bull-camp as long as current trend structure stays in place
Momentum in the S&P 500 continued yesterday after the rally began Wednesday following the outcome of the FOMC, bringing the index to channel resistance we had penciled in off the 9/14 swing low. The market couldn’t push it through, setting in motion the current decline off yesterday’s high. (Keep the upper parallel of the channel in mind as price action off it highlights its significance.)
The Nasdaq is the leading index right now, and given the riskier nature of the stocks which the index is composed of, it’s a good sign for the market. However, the divergence between the tech-heavy index and the S&P 500/Dow/Russel 2000 can present a concern. Divergences can disappear quickly, though, so unless we see price action give indication it is something to be concerned about, we will keep one eye on it, with most of our attention focused on the trend higher.
Looking for one of a couple of things to happen here: A short period of consolidation before resuming up towards the 2190/94 resistance zone, or a pullback into the 2163/56 support zone/lower parallel of channel. If the latter happens, it will take a little steam out of the bullish thesis, but give us a level from which to assess risk - a defining line of support. If a consolidation emerges we will evaluate it as we go. In the end, as long as higher highs and higher lows are carving themselves out and the S&P stays in the channel, we will remain in the bull-camp.
Start improving your trading today by utilizing one of our many free trading guides.
---Written by Paul Robinson, Market Analyst
If you would like to receive articles directly to your inbox, SIGN UP HERE.
You can follow Paul on Twitter at @PaulRobinonFX.
DailyFX provides forex news and technical analysis on the trends that influence the global currency markets.
Learn forex trading with a free practice account and trading charts from FXCM.
