S&P 500: Head-and-Shoulders Pattern Should Bear Fruit for the Shorts
DailyFX.com -
What’s inside:
Head-and-shoulders on the short-term chart
Triggered in overnight futures trade
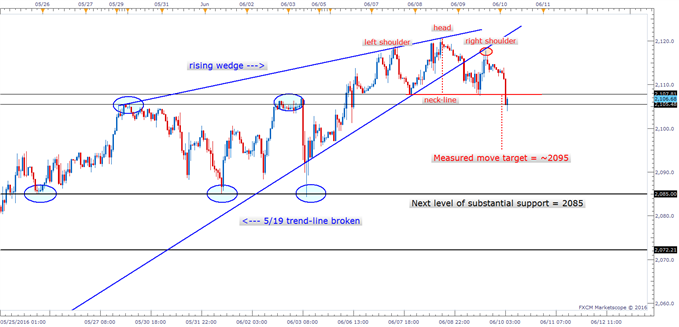
Measured move target ~2095, but next level of real support not until 2085
Yesterday’s decline in the market pushed the S&P 500 (FXCM: SPX500) into our noted support level of support just below 2108 and held almost to the decimal point. This furthered the importance of this level in the short-term.
The subsequent bounce off support saw the S&P move back to test the bottom-side of the trend-line which it broke (the t-line also constitutes the bottom of the broken wedge). The price sequence we are seeing this week has thus far created a textbook ‘head-and-shoulders’ pattern, with the right shoulder taking shape on the trend-line retest.
The neckline, that important 2108 level, was broken in overnight trade. There is also support at two prior peaks around 2105, which was briefly breached this morning and now where the market currently stands. The strong hourly close below the neckline suggests the 2105 area won’t have much weight as support.
The measured move target, calculated by subtracting the height of the pattern (~13 handles), from the neckline (2108) points to a move lower to 1995. However, no really significant price support comes in until the widely watched level at 2085. So, really the target is 2085, the first significant level of actual support and not the derived target using a measured-move approach.
SPX500 Hourly
Yesterday, we noted that the more opportune short might be in the Nasdaq 100 given its relative weakness to the S&P, but given the clean head-and-shoulders set-up we will stick with the S&P for now.
---Written by Paul Robinson, Market Analyst
You can follow Paul on Twitter at @PaulRobinsonFX, and/or email him directly at probinson@fxcm.com.
DailyFX provides forex news and technical analysis on the trends that influence the global currency markets.
Learn forex trading with a free practice account and trading charts from FXCM.

 Yahoo Finance

