
 Yahoo Finance
 Overbought vs. Oversold and What This Means for Traders
Talking Points:
Overbought means an extended price move to the upside; oversold to the downside.
When price reaches these extreme levels, a reversal is possible.
The Relative Strength Index (RSI) can be used to confirm a reversal.
Like many professions, trading involves a lot of jargon that is difficult to follow by someone new to the industry. It’s our job as instructors to fill in as many knowledge gaps as possible to make the education process as simple as possible. Today, we will take a look at what it means for a currency pair to be overbought or oversold, and most importantly, what trading opportunities arise from these situations.
Overbought vs. Oversold
These two terms actually describe themselves pretty well. Overbought describes a period of time where there has been a significant and consistent upward move in price over a period of time without much pullback. This is clearly defined by a chart showing price movement from the “lower-left to upper-right” like the chart shown below.
Learn Forex: USDJPY Hourly Chart – Overbought
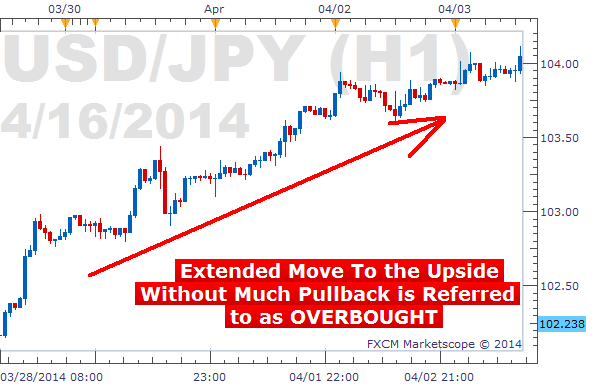
(Created using FXCM Marketscope 2.0)
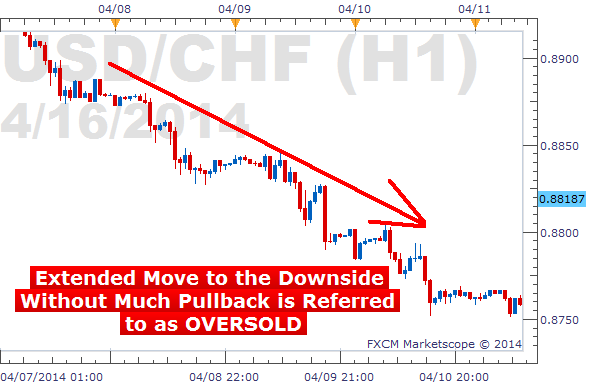
The term Oversold describes a period of time where there has been a significant and consistent downward move in price over a period of time without much pullback. Basically a move from the “upper-left to the lower-right.”
Learn Forex: USDCHF Hourly Chart – Oversold
Because price cannot move in one direction forever, price will turn around at some point. Currency pairs that are overbought or oversold sometimes have a greater chance of reversing direction, but could remain overbought or oversold for a very long time. So we need to use an oscillator to help us determine when a reversal is actually occurring.
Reading the RSI
There is a quick tool you can use to gauge overbought and oversold levels, the Relative Strength Index. For a full explanation for how to use the RSI, click here for a FREE video course. The premise is simple, however. When RSI moves above 70, it is overbought and could lead to a downward move. When RSI moves below 30, it is oversold and could lead to an upward move.
Learn Forex: Relative Strength Index, Overbought and Oversold Levels

But, we must be patient before we enter our trades, because sometimes the RSI can stay overbought or oversold for quite awhile. The worst thing we can do is try to pick a top or a bottom of a strong move that continues to move into further overbought or oversold territory. So we must wait until the RSI crosses back under 70 or crosses back above 30.
Learn Forex: Relative Strength Index, Overbought and Oversold Levels
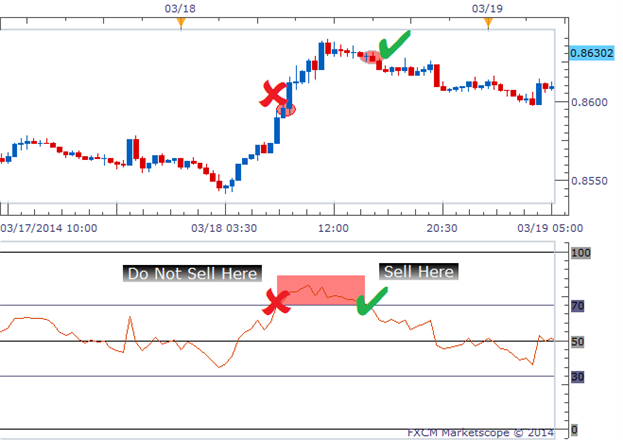
The image above shows the RSI clearly breaking above the 70 level resulting in an overbought reading, but we do not want to immediately sell because we do not know how far price could continue to rally. We want to wait until the RSI falls back below 70 and then place our sell trade. This gives us a better entry and a higher probability trade.
When the RSI falls below 30, same rules apply. We want to wait until the RSI crosses back above 30 before we place a buy trade.
Putting RSI to Work
Are you ready to put the concept of overbought and oversold levels to work? Test this trade technique risk free in a FXCM Demo account. It only takes a couple minutes to get setup. As always, if you have any questions, feel free to write.
Good trading!
---Written by Rob Pasche
To contact Rob, email rpasche@dailyfx.com.
Sign up for my email list to stay up to date with my latest articles and videos.
Want to learn about the Mirror Trader automated trading platform? Join us for a live Mirror Trader Platform walkthrough Wednesdays at 3pm ET.
DailyFX provides forex news and technical analysis on the trends that influence the global currency markets.
Learn forex trading with a free practice account and trading charts from FXCM.
