
 Yahoo Finance
 OVB Holding (ETR:O4B) shareholders have endured a 14% loss from investing in the stock a year ago
The simplest way to benefit from a rising market is to buy an index fund. While individual stocks can be big winners, plenty more fail to generate satisfactory returns. For example, the OVB Holding AG (ETR:O4B) share price is down 17% in the last year. That falls noticeably short of the market return of around 12%. On the bright side, the stock is actually up 4.4% in the last three years. The falls have accelerated recently, with the share price down 12% in the last three months.
Since shareholders are down over the longer term, lets look at the underlying fundamentals over the that time and see if they've been consistent with returns.
View our latest analysis for OVB Holding
While markets are a powerful pricing mechanism, share prices reflect investor sentiment, not just underlying business performance. By comparing earnings per share (EPS) and share price changes over time, we can get a feel for how investor attitudes to a company have morphed over time.
Even though the OVB Holding share price is down over the year, its EPS actually improved. Of course, the situation might betray previous over-optimism about growth.
The divergence between the EPS and the share price is quite notable, during the year. So it's well worth checking out some other metrics, too.
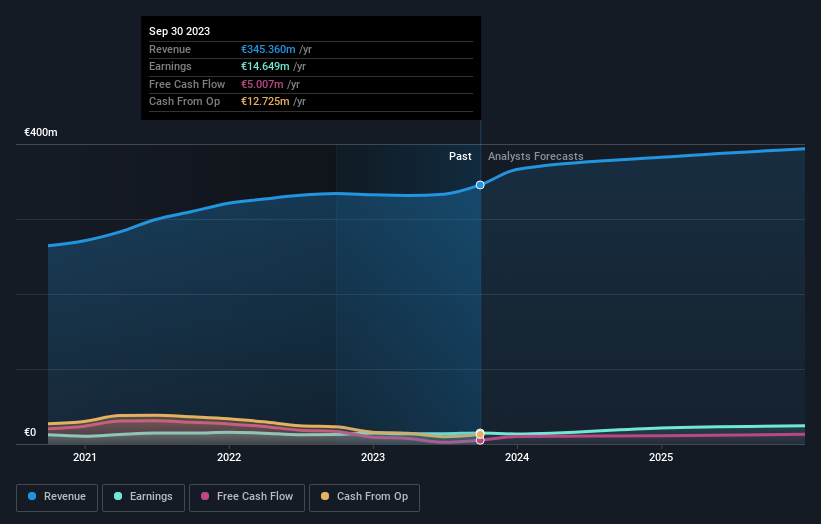
We don't see any weakness in the OVB Holding's dividend so the steady payout can't really explain the share price drop. From what we can see, revenue is pretty flat, so that doesn't really explain the share price drop. Of course, it could simply be that it simply fell short of the market consensus expectations.
The company's revenue and earnings (over time) are depicted in the image below (click to see the exact numbers).
We know that OVB Holding has improved its bottom line lately, but what does the future have in store? If you are thinking of buying or selling OVB Holding stock, you should check out this free report showing analyst profit forecasts.
What About Dividends?
When looking at investment returns, it is important to consider the difference between total shareholder return (TSR) and share price return. The TSR is a return calculation that accounts for the value of cash dividends (assuming that any dividend received was reinvested) and the calculated value of any discounted capital raisings and spin-offs. Arguably, the TSR gives a more comprehensive picture of the return generated by a stock. We note that for OVB Holding the TSR over the last 1 year was -14%, which is better than the share price return mentioned above. And there's no prize for guessing that the dividend payments largely explain the divergence!
A Different Perspective
While the broader market gained around 12% in the last year, OVB Holding shareholders lost 14% (even including dividends). Even the share prices of good stocks drop sometimes, but we want to see improvements in the fundamental metrics of a business, before getting too interested. Longer term investors wouldn't be so upset, since they would have made 7%, each year, over five years. It could be that the recent sell-off is an opportunity, so it may be worth checking the fundamental data for signs of a long term growth trend. I find it very interesting to look at share price over the long term as a proxy for business performance. But to truly gain insight, we need to consider other information, too. Case in point: We've spotted 1 warning sign for OVB Holding you should be aware of.
For those who like to find winning investments this free list of growing companies with recent insider purchasing, could be just the ticket.
Please note, the market returns quoted in this article reflect the market weighted average returns of stocks that currently trade on German exchanges.
Have feedback on this article? Concerned about the content? Get in touch with us directly. Alternatively, email editorial-team (at) simplywallst.com.
This article by Simply Wall St is general in nature. We provide commentary based on historical data and analyst forecasts only using an unbiased methodology and our articles are not intended to be financial advice. It does not constitute a recommendation to buy or sell any stock, and does not take account of your objectives, or your financial situation. We aim to bring you long-term focused analysis driven by fundamental data. Note that our analysis may not factor in the latest price-sensitive company announcements or qualitative material. Simply Wall St has no position in any stocks mentioned.
