
 Yahoo Finance
 Ovato (ASX:OVT) Has Some Way To Go To Become A Multi-Bagger
If we want to find a potential multi-bagger, often there are underlying trends that can provide clues. One common approach is to try and find a company with returns on capital employed (ROCE) that are increasing, in conjunction with a growing amount of capital employed. Ultimately, this demonstrates that it's a business that is reinvesting profits at increasing rates of return. In light of that, when we looked at Ovato (ASX:OVT) and its ROCE trend, we weren't exactly thrilled.
Understanding Return On Capital Employed (ROCE)
For those that aren't sure what ROCE is, it measures the amount of pre-tax profits a company can generate from the capital employed in its business. Analysts use this formula to calculate it for Ovato:
Return on Capital Employed = Earnings Before Interest and Tax (EBIT) ÷ (Total Assets - Current Liabilities)
0.081 = AU$14m ÷ (AU$380m - AU$202m) (Based on the trailing twelve months to December 2020).
Thus, Ovato has an ROCE of 8.1%. In absolute terms, that's a low return but it's around the Commercial Services industry average of 9.0%.
See our latest analysis for Ovato
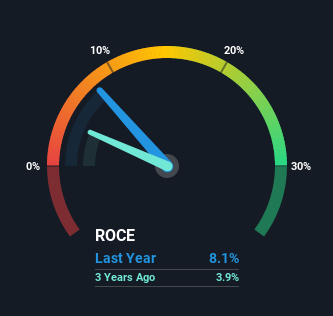
Historical performance is a great place to start when researching a stock so above you can see the gauge for Ovato's ROCE against it's prior returns. If you want to delve into the historical earnings, revenue and cash flow of Ovato, check out these free graphs here.
What Can We Tell From Ovato's ROCE Trend?
Over the past five years, Ovato's ROCE has remained relatively flat while the business is using 45% less capital than before. This indicates to us that assets are being sold and thus the business is likely shrinking, which you'll remember isn't the typical ingredients for an up-and-coming multi-bagger. Not only that, but the low returns on this capital mentioned earlier would leave most investors unimpressed.
Another point to note, we noticed the company has increased current liabilities over the last five years. This is intriguing because if current liabilities hadn't increased to 53% of total assets, this reported ROCE would probably be less than8.1% because total capital employed would be higher.The 8.1% ROCE could be even lower if current liabilities weren't 53% of total assets, because the the formula would show a larger base of total capital employed. So with current liabilities at such high levels, this effectively means the likes of suppliers or short-term creditors are funding a meaningful part of the business, which in some instances can bring some risks.
What We Can Learn From Ovato's ROCE
It's a shame to see that Ovato is effectively shrinking in terms of its capital base. And investors may be expecting the fundamentals to get a lot worse because the stock has crashed 98% over the last five years. On the whole, we aren't too inspired by the underlying trends and we think there may be better chances of finding a multi-bagger elsewhere.
Since virtually every company faces some risks, it's worth knowing what they are, and we've spotted 4 warning signs for Ovato (of which 2 are a bit unpleasant!) that you should know about.
If you want to search for solid companies with great earnings, check out this free list of companies with good balance sheets and impressive returns on equity.
This article by Simply Wall St is general in nature. It does not constitute a recommendation to buy or sell any stock, and does not take account of your objectives, or your financial situation. We aim to bring you long-term focused analysis driven by fundamental data. Note that our analysis may not factor in the latest price-sensitive company announcements or qualitative material. Simply Wall St has no position in any stocks mentioned.
Have feedback on this article? Concerned about the content? Get in touch with us directly. Alternatively, email editorial-team (at) simplywallst.com.
