
 Yahoo Finance
 Is Orora Limited (ASX:ORA) A Financially Sound Company?

Small-caps and large-caps are wildly popular among investors, however, mid-cap stocks, such as Orora Limited (ASX:ORA), with a market capitalization of AU$4.23B, rarely draw their attention from the investing community. Despite this, the two other categories have lagged behind the risk-adjusted returns of commonly ignored mid-cap stocks. This article will examine ORA’s financial liquidity and debt levels to get an idea of whether the company can deal with cyclical downturns and maintain funds to accommodate strategic spending for future growth. Remember this is a very top-level look that focuses exclusively on financial health, so I recommend a deeper analysis into ORA here. See our latest analysis for Orora
How does ORA’s operating cash flow stack up against its debt?
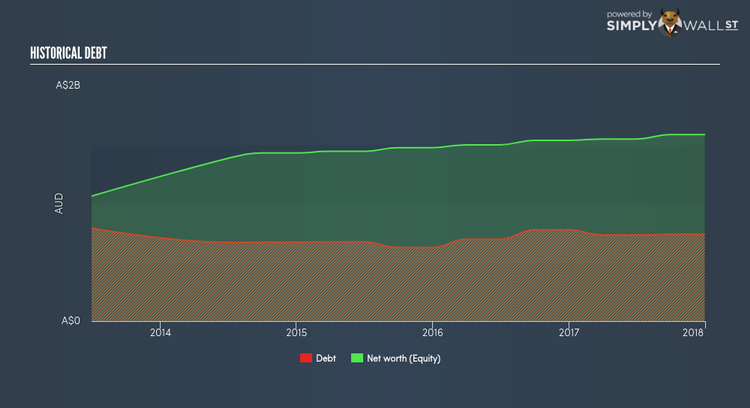
ORA’s debt levels surged from AU$695.70M to AU$732.50M over the last 12 months , which is made up of current and long term debt. With this growth in debt, the current cash and short-term investment levels stands at AU$58.50M for investing into the business. Additionally, ORA has produced AU$351.20M in operating cash flow over the same time period, leading to an operating cash to total debt ratio of 47.95%, meaning that ORA’s operating cash is sufficient to cover its debt. This ratio can also be interpreted as a measure of efficiency as an alternative to return on assets. In ORA’s case, it is able to generate 0.48x cash from its debt capital.
Can ORA meet its short-term obligations with the cash in hand?
At the current liabilities level of AU$985.40M liabilities, the company has been able to meet these commitments with a current assets level of AU$1.17B, leading to a 1.19x current account ratio. Generally, for Packaging companies, this is a reasonable ratio since there is a bit of a cash buffer without leaving too much capital in a low-return environment.
Is ORA’s debt level acceptable?
With a debt-to-equity ratio of 46.54%, ORA can be considered as an above-average leveraged company. This is not uncommon for a mid-cap company given that debt tends to be lower-cost and at times, more accessible. We can check to see whether ORA is able to meet its debt obligations by looking at the net interest coverage ratio. A company generating earnings before interest and tax (EBIT) at least three times its net interest payments is considered financially sound. In ORA’s, case, the ratio of 8.07x suggests that interest is appropriately covered, which means that debtors may be willing to loan the company more money, giving ORA ample headroom to grow its debt facilities.
Next Steps:
ORA’s high cash coverage means that, although its debt levels are high, the company is able to utilise its borrowings efficiently in order to generate cash flow. Since there is also no concerns around ORA’s liquidity needs, this may be its optimal capital structure for the time being. I admit this is a fairly basic analysis for ORA’s financial health. Other important fundamentals need to be considered alongside. I recommend you continue to research Orora to get a more holistic view of the mid-cap by looking at:
Future Outlook: What are well-informed industry analysts predicting for ORA’s future growth? Take a look at our free research report of analyst consensus for ORA’s outlook.
Valuation: What is ORA worth today? Is the stock undervalued, even when its growth outlook is factored into its intrinsic value? The intrinsic value infographic in our free research report helps visualize whether ORA is currently mispriced by the market.
Other High-Performing Stocks: Are there other stocks that provide better prospects with proven track records? Explore our free list of these great stocks here.
To help readers see pass the short term volatility of the financial market, we aim to bring you a long-term focused research analysis purely driven by fundamental data. Note that our analysis does not factor in the latest price sensitive company announcements.
The author is an independent contributor and at the time of publication had no position in the stocks mentioned.
