
 Yahoo Finance
 Orogen Royalties' (CVE:OGN) Returns On Capital Are Heading Higher
If you're not sure where to start when looking for the next multi-bagger, there are a few key trends you should keep an eye out for. Amongst other things, we'll want to see two things; firstly, a growing return on capital employed (ROCE) and secondly, an expansion in the company's amount of capital employed. Put simply, these types of businesses are compounding machines, meaning they are continually reinvesting their earnings at ever-higher rates of return. Speaking of which, we noticed some great changes in Orogen Royalties' (CVE:OGN) returns on capital, so let's have a look.
Understanding Return On Capital Employed (ROCE)
For those who don't know, ROCE is a measure of a company's yearly pre-tax profit (its return), relative to the capital employed in the business. To calculate this metric for Orogen Royalties, this is the formula:
Return on Capital Employed = Earnings Before Interest and Tax (EBIT) ÷ (Total Assets - Current Liabilities)
0.0019 = CA$115k ÷ (CA$61m - CA$1.6m) (Based on the trailing twelve months to June 2023).
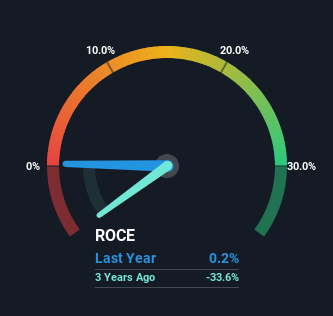
Thus, Orogen Royalties has an ROCE of 0.2%. In absolute terms, that's a low return and it also under-performs the Metals and Mining industry average of 3.7%.
Check out our latest analysis for Orogen Royalties
Above you can see how the current ROCE for Orogen Royalties compares to its prior returns on capital, but there's only so much you can tell from the past. If you'd like, you can check out the forecasts from the analysts covering Orogen Royalties here for free.
So How Is Orogen Royalties' ROCE Trending?
We're delighted to see that Orogen Royalties is reaping rewards from its investments and is now generating some pre-tax profits. About five years ago the company was generating losses but things have turned around because it's now earning 0.2% on its capital. And unsurprisingly, like most companies trying to break into the black, Orogen Royalties is utilizing 919% more capital than it was five years ago. We like this trend, because it tells us the company has profitable reinvestment opportunities available to it, and if it continues going forward that can lead to a multi-bagger performance.
One more thing to note, Orogen Royalties has decreased current liabilities to 2.7% of total assets over this period, which effectively reduces the amount of funding from suppliers or short-term creditors. So shareholders would be pleased that the growth in returns has mostly come from underlying business performance.
In Conclusion...
To the delight of most shareholders, Orogen Royalties has now broken into profitability. And since the stock has fallen 48% over the last five years, there might be an opportunity here. With that in mind, we believe the promising trends warrant this stock for further investigation.
One more thing to note, we've identified 4 warning signs with Orogen Royalties and understanding these should be part of your investment process.
While Orogen Royalties isn't earning the highest return, check out this free list of companies that are earning high returns on equity with solid balance sheets.
Have feedback on this article? Concerned about the content? Get in touch with us directly. Alternatively, email editorial-team (at) simplywallst.com.
This article by Simply Wall St is general in nature. We provide commentary based on historical data and analyst forecasts only using an unbiased methodology and our articles are not intended to be financial advice. It does not constitute a recommendation to buy or sell any stock, and does not take account of your objectives, or your financial situation. We aim to bring you long-term focused analysis driven by fundamental data. Note that our analysis may not factor in the latest price-sensitive company announcements or qualitative material. Simply Wall St has no position in any stocks mentioned.
