
 Yahoo Finance
 Those who invested in Hewlett Packard Enterprise (NYSE:HPE) three years ago are up 25%
Low-cost index funds make it easy to achieve average market returns. But across the board there are plenty of stocks that underperform the market. That's what has happened with the Hewlett Packard Enterprise Company (NYSE:HPE) share price. It's up 14% over three years, but that is below the market return. Zooming in, the stock is up a respectable 13% in the last year.
So let's investigate and see if the longer term performance of the company has been in line with the underlying business' progress.
Check out our latest analysis for Hewlett Packard Enterprise
While markets are a powerful pricing mechanism, share prices reflect investor sentiment, not just underlying business performance. One imperfect but simple way to consider how the market perception of a company has shifted is to compare the change in the earnings per share (EPS) with the share price movement.
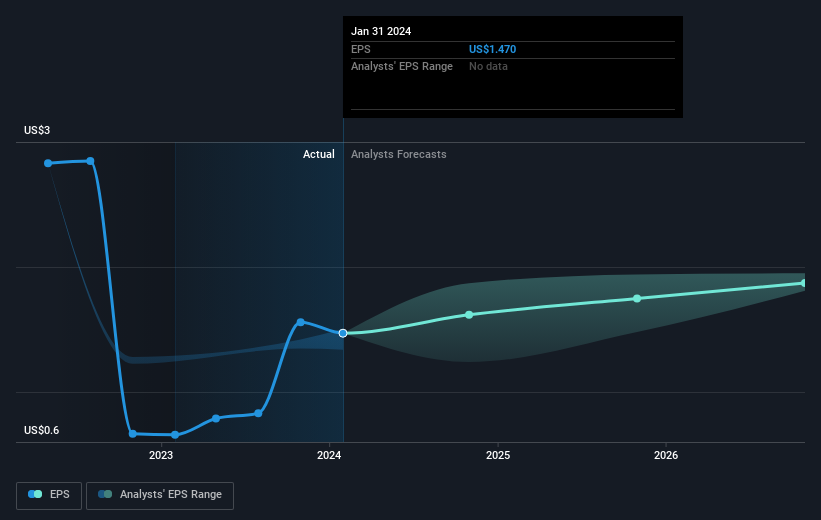
Hewlett Packard Enterprise became profitable within the last three years. So we would expect a higher share price over the period.
You can see below how EPS has changed over time (discover the exact values by clicking on the image).
We know that Hewlett Packard Enterprise has improved its bottom line lately, but is it going to grow revenue? Check if analysts think Hewlett Packard Enterprise will grow revenue in the future.
What About Dividends?
As well as measuring the share price return, investors should also consider the total shareholder return (TSR). The TSR incorporates the value of any spin-offs or discounted capital raisings, along with any dividends, based on the assumption that the dividends are reinvested. It's fair to say that the TSR gives a more complete picture for stocks that pay a dividend. We note that for Hewlett Packard Enterprise the TSR over the last 3 years was 25%, which is better than the share price return mentioned above. And there's no prize for guessing that the dividend payments largely explain the divergence!
A Different Perspective
Hewlett Packard Enterprise provided a TSR of 16% over the last twelve months. Unfortunately this falls short of the market return. The silver lining is that the gain was actually better than the average annual return of 5% per year over five year. This suggests the company might be improving over time. I find it very interesting to look at share price over the long term as a proxy for business performance. But to truly gain insight, we need to consider other information, too. For instance, we've identified 3 warning signs for Hewlett Packard Enterprise that you should be aware of.
If you would prefer to check out another company -- one with potentially superior financials -- then do not miss this free list of companies that have proven they can grow earnings.
Please note, the market returns quoted in this article reflect the market weighted average returns of stocks that currently trade on American exchanges.
Have feedback on this article? Concerned about the content? Get in touch with us directly. Alternatively, email editorial-team@simplywallst.com
Simply Wall St analyst Simply Wall St and Simply Wall St have no position in any of the companies mentioned. This article is general in nature. We provide commentary based on historical data and analyst forecasts only using an unbiased methodology and our articles are not intended to be financial advice. It does not constitute a recommendation to buy or sell any stock and does not take account of your objectives, or your financial situation. We aim to bring you long-term focused analysis driven by fundamental data. Note that our analysis may not factor in the latest price-sensitive company announcements or qualitative material.
