
 Yahoo Finance
 OM Holdings Limited's (ASX:OMH) Stock Has Shown A Decent Performance: Have Financials A Role To Play?
Most readers would already know that OM Holdings' (ASX:OMH) stock increased by 6.9% over the past three months. Given that stock prices are usually aligned with a company's financial performance in the long-term, we decided to investigate if the company's decent financials had a hand to play in the recent price move. In this article, we decided to focus on OM Holdings' ROE.
Return on equity or ROE is an important factor to be considered by a shareholder because it tells them how effectively their capital is being reinvested. Put another way, it reveals the company's success at turning shareholder investments into profits.
View our latest analysis for OM Holdings
How To Calculate Return On Equity?
The formula for return on equity is:
Return on Equity = Net Profit (from continuing operations) ÷ Shareholders' Equity
So, based on the above formula, the ROE for OM Holdings is:
24% = US$117m ÷ US$489m (Based on the trailing twelve months to June 2022).
The 'return' is the amount earned after tax over the last twelve months. Another way to think of that is that for every A$1 worth of equity, the company was able to earn A$0.24 in profit.
Why Is ROE Important For Earnings Growth?
Thus far, we have learned that ROE measures how efficiently a company is generating its profits. We now need to evaluate how much profit the company reinvests or "retains" for future growth which then gives us an idea about the growth potential of the company. Assuming all else is equal, companies that have both a higher return on equity and higher profit retention are usually the ones that have a higher growth rate when compared to companies that don't have the same features.
OM Holdings' Earnings Growth And 24% ROE
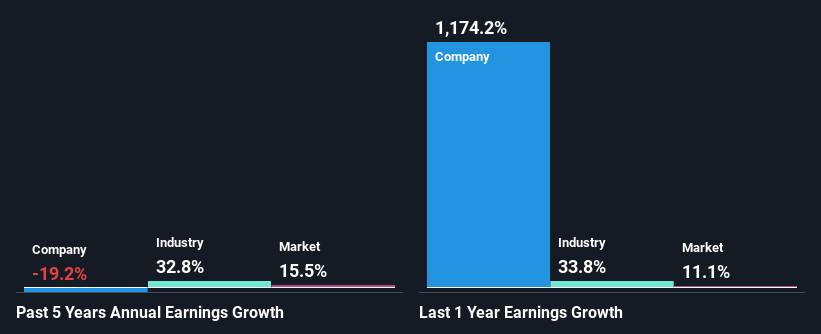
Firstly, we acknowledge that OM Holdings has a significantly high ROE. Secondly, even when compared to the industry average of 15% the company's ROE is quite impressive. Needless to say, we are quite surprised to see that OM Holdings' net income shrunk at a rate of 19% over the past five years. We reckon that there could be some other factors at play here that are preventing the company's growth. For example, it could be that the company has a high payout ratio or the business has allocated capital poorly, for instance.
So, as a next step, we compared OM Holdings' performance against the industry and were disappointed to discover that while the company has been shrinking its earnings, the industry has been growing its earnings at a rate of 33% in the same period.
Earnings growth is a huge factor in stock valuation. The investor should try to establish if the expected growth or decline in earnings, whichever the case may be, is priced in. Doing so will help them establish if the stock's future looks promising or ominous. One good indicator of expected earnings growth is the P/E ratio which determines the price the market is willing to pay for a stock based on its earnings prospects. So, you may want to check if OM Holdings is trading on a high P/E or a low P/E, relative to its industry.
Is OM Holdings Using Its Retained Earnings Effectively?
OM Holdings' low three-year median payout ratio of 21% (implying that it retains the remaining 79% of its profits) comes as a surprise when you pair it with the shrinking earnings. The low payout should mean that the company is retaining most of its earnings and consequently, should see some growth. So there could be some other explanations in that regard. For example, the company's business may be deteriorating.
Moreover, OM Holdings has been paying dividends for four years, which is a considerable amount of time, suggesting that management must have perceived that the shareholders prefer consistent dividends even though earnings have been shrinking.
Conclusion
Overall, we feel that OM Holdings certainly does have some positive factors to consider. Although, we are disappointed to see a lack of growth in earnings even in spite of a high ROE and and a high reinvestment rate. We believe that there might be some outside factors that could be having a negative impact on the business. Having said that, looking at current analyst estimates, we found that the company's earnings growth rate is expected to see a huge improvement. Are these analysts expectations based on the broad expectations for the industry, or on the company's fundamentals? Click here to be taken to our analyst's forecasts page for the company.
Have feedback on this article? Concerned about the content? Get in touch with us directly. Alternatively, email editorial-team (at) simplywallst.com.
This article by Simply Wall St is general in nature. We provide commentary based on historical data and analyst forecasts only using an unbiased methodology and our articles are not intended to be financial advice. It does not constitute a recommendation to buy or sell any stock, and does not take account of your objectives, or your financial situation. We aim to bring you long-term focused analysis driven by fundamental data. Note that our analysis may not factor in the latest price-sensitive company announcements or qualitative material. Simply Wall St has no position in any stocks mentioned.
Join A Paid User Research Session
You’ll receive a US$30 Amazon Gift card for 1 hour of your time while helping us build better investing tools for the individual investors like yourself. Sign up here
