
 Yahoo Finance
 Olympia Financial Group (TSE:OLY) shareholders have earned a 44% CAGR over the last three years
The most you can lose on any stock (assuming you don't use leverage) is 100% of your money. But in contrast you can make much more than 100% if the company does well. To wit, the Olympia Financial Group Inc. (TSE:OLY) share price has flown 147% in the last three years. That sort of return is as solid as granite. Meanwhile the share price is 2.9% higher than it was a week ago.
So let's assess the underlying fundamentals over the last 3 years and see if they've moved in lock-step with shareholder returns.
View our latest analysis for Olympia Financial Group
While markets are a powerful pricing mechanism, share prices reflect investor sentiment, not just underlying business performance. One imperfect but simple way to consider how the market perception of a company has shifted is to compare the change in the earnings per share (EPS) with the share price movement.
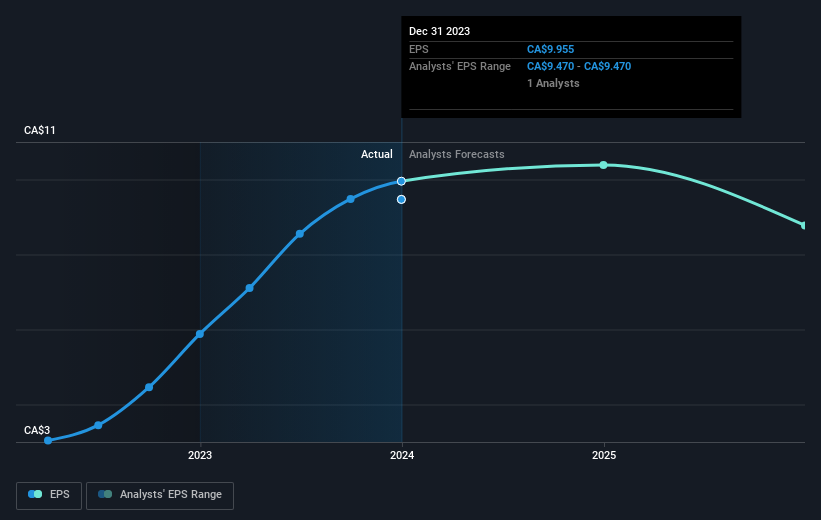
During three years of share price growth, Olympia Financial Group achieved compound earnings per share growth of 44% per year. The average annual share price increase of 35% is actually lower than the EPS growth. Therefore, it seems the market has moderated its expectations for growth, somewhat. We'd venture the lowish P/E ratio of 11.11 also reflects the negative sentiment around the stock.
You can see how EPS has changed over time in the image below (click on the chart to see the exact values).
We like that insiders have been buying shares in the last twelve months. Having said that, most people consider earnings and revenue growth trends to be a more meaningful guide to the business. It might be well worthwhile taking a look at our free report on Olympia Financial Group's earnings, revenue and cash flow.
What About Dividends?
As well as measuring the share price return, investors should also consider the total shareholder return (TSR). Whereas the share price return only reflects the change in the share price, the TSR includes the value of dividends (assuming they were reinvested) and the benefit of any discounted capital raising or spin-off. So for companies that pay a generous dividend, the TSR is often a lot higher than the share price return. As it happens, Olympia Financial Group's TSR for the last 3 years was 197%, which exceeds the share price return mentioned earlier. And there's no prize for guessing that the dividend payments largely explain the divergence!
A Different Perspective
We're pleased to report that Olympia Financial Group shareholders have received a total shareholder return of 23% over one year. That's including the dividend. However, the TSR over five years, coming in at 23% per year, is even more impressive. I find it very interesting to look at share price over the long term as a proxy for business performance. But to truly gain insight, we need to consider other information, too. For example, we've discovered 3 warning signs for Olympia Financial Group (2 are a bit unpleasant!) that you should be aware of before investing here.
Olympia Financial Group is not the only stock that insiders are buying. For those who like to find winning investments this free list of growing companies with recent insider purchasing, could be just the ticket.
Please note, the market returns quoted in this article reflect the market weighted average returns of stocks that currently trade on Canadian exchanges.
Have feedback on this article? Concerned about the content? Get in touch with us directly. Alternatively, email editorial-team (at) simplywallst.com.
This article by Simply Wall St is general in nature. We provide commentary based on historical data and analyst forecasts only using an unbiased methodology and our articles are not intended to be financial advice. It does not constitute a recommendation to buy or sell any stock, and does not take account of your objectives, or your financial situation. We aim to bring you long-term focused analysis driven by fundamental data. Note that our analysis may not factor in the latest price-sensitive company announcements or qualitative material. Simply Wall St has no position in any stocks mentioned.
