
 Yahoo Finance
 Ollie's Bargain (OLLI) Q2 Earnings Top Estimates, Comps Rise
Shares of Ollie's Bargain Outlet Holdings, Inc. OLLI rose 2.1% during the after-market trading session on Aug 27. The company registered stellar performance in second-quarter fiscal 2020, wherein both the top and the bottom lines not only beat the Zacks Consensus Estimate but also grew year over year. It was the second straight quarter of sales and earnings beat. Notably, the company witnessed sturdy comparable store sales growth throughout the quarter.
Clearly, Ollie's Bargain business operating model of “buying cheap and selling cheap” and focus on value-driven merchandise assortment positioned it well to meet increased customer demand amid the ongoing pandemic. The company also benefited from consumer spending related with receipt of federal relief funds for the coronavirus crisis.
Notably, shares of this Harrisburg, PA-based company have increased 17% in the past three months against the industry’s decline of 5.1%.
Quarterly Results
Ollie’s Bargain delivered adjusted earnings of $1.04 per share that beat the Zacks Consensus Estimate of 87 cents and surged from 35 cents reported in the year-ago quarter. The improvement can be attributed to higher net sales and better expense management.
Net sales improved 58.5% year over year to $529.3 million and surpassed the consensus mark of $515.9 million. The increase in the top line can be attributed to comparable store sales growth and robust new store performance. Comparable store sales increased 43.3% during the quarter driven by higher traffic levels and a significantly larger average basket. The company’s top-performing categories were health and beauty aids, housewares, bed and bath, flooring, and electronics.
Undeniably, the company efficiently responded to changing consumer demand during the quarter. Management highlighted that comparable store sales are currently tracking in the high teens owing to customers’ favorable response to great deals. However, it expects sales growth to continue to slow down through the second half of the year.
Ollies Bargain Outlet Holdings, Inc. Price, Consensus and EPS Surprise
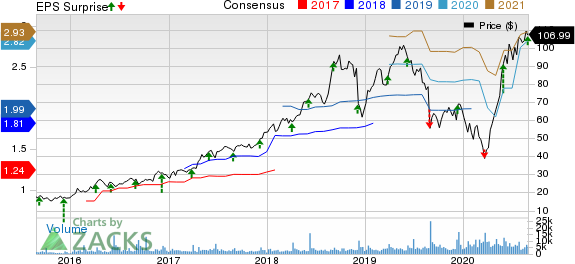
Ollies Bargain Outlet Holdings, Inc. price-consensus-eps-surprise-chart | Ollies Bargain Outlet Holdings, Inc. Quote
Meanwhile, gross profit soared 66.8% to $206.8 million during the quarter under review, while gross margin expanded 190 basis points to 39.1%. The increase in gross margin was due to improvement in merchandise margin owing to increased markup and leveraging of supply chain costs as a percentage of net sales.
SG&A expenses jumped to $109.1 million during the quarter under review from $87.4 million in the prior-year period on account of increased number of stores and higher store payroll and variable selling expenses. However, as a percentage of net sales, SG&A expenses decreased 560 basis points to 20.6%. The contraction was driven by significant leverage in payroll and occupancy as well as other fixed costs owing to comparable store sales growth and cost containment efforts.
Operating income grew to $92 million in the second quarter from $30.8 million in the prior-year period. Again, operating margin increased 820 basis points to 17.4% owing to top-line growth, gross margin expansion and tight cost controls. Adjusted EBITDA rose to $99.4 million during the quarter under review from $37.5 million in the year-ago period, while adjusted EBITDA margin expanded 760 basis points to 18.8%.
Store Update
During the second quarter, Ollie’s Bargain opened six stores, taking the total count to 366 stores in 25 states. The company plans to open 46 store locations, including one relocation and one closure during fiscal 2020. So far in the third quarter, the company has opened four stores.
Financial Aspects
Ollie’s Bargain, carrying a Zacks Rank #2 (Buy) at present, ended the quarter with cash and cash equivalents of $305.1 million, reflecting significant growth from $78.5 million at the end of the prior quarter. The company’s liquidity position remained strong, with no borrowings under its $100-million revolving credit facility and $92 million of availability under the facility as of the end of the second quarter of fiscal 2020.
As of Aug 1, 2020, its total borrowings (comprised solely of finance lease obligations) were $0.9 million and shareholders’ equity was $1,218.1 million. Inventories as of the end of the quarter declined 7.7% to $327.2 million, principally due to higher sales productivity throughout the quarter.
Management incurred capital expenditures of $5.7 million in the second quarter. For fiscal 2020, the company expects capital expenditures of $30-$35 million directed toward store openings, IT projects and store-level initiatives.
3 Hot Stocks to Consider
Big Lots BIG, a Zacks Rank #1 (Strong Buy) stock, has a long-term earnings growth rate of 7.1%. You can see the complete list of today’s Zacks #1 Rank stocks here.
Target TGT has a long-term earnings growth rate of 7.2%. Currently, it sports a Zacks Rank #1.
Sprouts Farmers Market SFM has a trailing four-quarter average earnings surprise of 49.9% and carries a Zacks Rank #2.
Today's Best Stocks from Zacks
Would you like to see the updated picks from our best market-beating strategies? From 2017 through Q2 2020, while the S&P 500 gained an impressive +44.0%, five of our strategies returned +50.9%, +93.8%, +122.2%, +153.0%, and even +156.8%.
This outperformance has not just been a recent phenomenon. From 2000 – Q2 2020, while the S&P averaged +5.5% per year, our top strategies averaged up to +51.7% per year.
See their latest picks free >>
Want the latest recommendations from Zacks Investment Research? Today, you can download 7 Best Stocks for the Next 30 Days. Click to get this free report
Target Corporation (TGT) : Free Stock Analysis Report
Big Lots, Inc. (BIG) : Free Stock Analysis Report
Sprouts Farmers Market, Inc. (SFM) : Free Stock Analysis Report
Ollies Bargain Outlet Holdings, Inc. (OLLI) : Free Stock Analysis Report
To read this article on Zacks.com click here.
Zacks Investment Research
