
 Yahoo Finance
 Are Oil Search Limited’s (ASX:OSH) Interest Costs Too High?

Small-caps and large-caps are wildly popular among investors; however, mid-cap stocks, such as Oil Search Limited (ASX:OSH) with a market-capitalization of AU$13.30b, rarely draw their attention. Despite this, commonly overlooked mid-caps have historically produced better risk-adjusted returns than their small and large-cap counterparts. Let’s take a look at OSH’s debt concentration and assess their financial liquidity to get an idea of their ability to fund strategic acquisitions and grow through cyclical pressures. Note that this information is centred entirely on financial health and is a top-level understanding, so I encourage you to look further into OSH here.
Check out our latest analysis for Oil Search
How much cash does OSH generate through its operations?
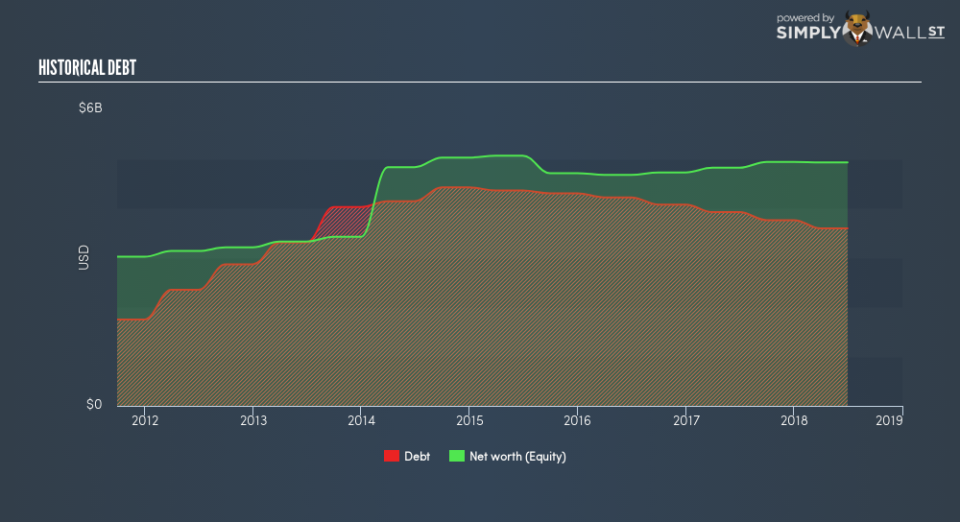
OSH’s debt levels have fallen from US$3.92b to US$3.59b over the last 12 months , which is made up of current and long term debt. With this debt repayment, OSH’s cash and short-term investments stands at US$412.1m , ready to deploy into the business. On top of this, OSH has produced cash from operations of US$639.6m during the same period of time, leading to an operating cash to total debt ratio of 17.8%, meaning that OSH’s debt is not appropriately covered by operating cash. This ratio can also be interpreted as a measure of efficiency as an alternative to return on assets. In OSH’s case, it is able to generate 0.18x cash from its debt capital.
Can OSH pay its short-term liabilities?
At the current liabilities level of US$644.0m liabilities, the company has maintained a safe level of current assets to meet its obligations, with the current ratio last standing at 1.09x. Usually, for Oil and Gas companies, this is a suitable ratio as there’s enough of a cash buffer without holding too capital in low return investments.
Can OSH service its debt comfortably?
With a debt-to-equity ratio of 72.9%, OSH can be considered as an above-average leveraged company. This is not uncommon for a mid-cap company given that debt tends to be lower-cost and at times, more accessible. No matter how high the company’s debt, if it can easily cover the interest payments, it’s considered to be efficient with its use of excess leverage. A company generating earnings after interest and tax at least three times its net interest payments is considered financially sound. In OSH’s case, the ratio of 3.07x suggests that interest is appropriately covered, which means that debtors may be willing to loan the company more money, giving OSH ample headroom to grow its debt facilities.
Next Steps:
At its current level of cash flow coverage, OSH has room for improvement to better cushion for events which may require debt repayment. However, the company exhibits proper management of current assets and upcoming liabilities. Keep in mind I haven’t considered other factors such as how OSH has been performing in the past. You should continue to research Oil Search to get a more holistic view of the stock by looking at:
Future Outlook: What are well-informed industry analysts predicting for OSH’s future growth? Take a look at our free research report of analyst consensus for OSH’s outlook.
Valuation: What is OSH worth today? Is the stock undervalued, even when its growth outlook is factored into its intrinsic value? The intrinsic value infographic in our free research report helps visualize whether OSH is currently mispriced by the market.
Other High-Performing Stocks: Are there other stocks that provide better prospects with proven track records? Explore our free list of these great stocks here.
To help readers see past the short term volatility of the financial market, we aim to bring you a long-term focused research analysis purely driven by fundamental data. Note that our analysis does not factor in the latest price-sensitive company announcements.
The author is an independent contributor and at the time of publication had no position in the stocks mentioned. For errors that warrant correction please contact the editor at editorial-team@simplywallst.com.
