
 Yahoo Finance
 NZDUSD May Have Made a Major Top
EURUSD, GBPUSD, USDCHF weekly momentum considerations
USDJPY trading difficulty described by a B wave
NZDUSD top could be major
--Subscribe to Jamie Saettele's distribution list in order to receive a free report to your inbox once a day.
--Tradingideas are availabletoJ.S. Trade Desk members.
EUR/USD
Weekly
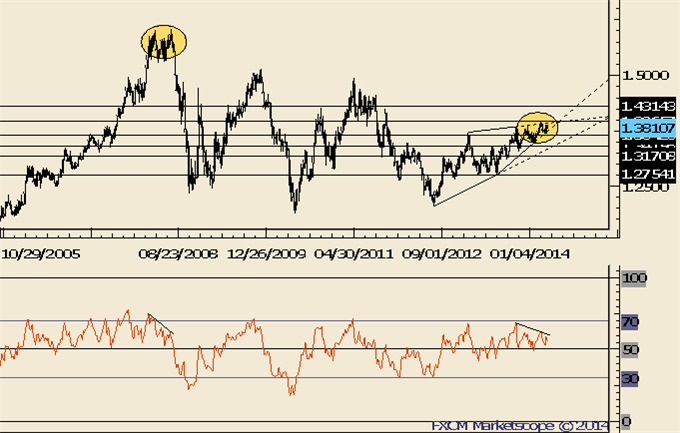
Chart Prepared by Jamie Saettele, CMT using Marketscope 2.0
Automate trades with Mirror Trader
-“EURUSD was never able to drop under 1.3642, finding low after NFP at 1.3672. Momentum wise, I am looking for a top. RSI at each top since December has been below 70. This weak momentum profile is not suggestive of a strong bull.” Weekly momentum is just as telling. The most recent top is accompanied by RSI divergence with RSI < 60. This is exceptionally bearish. A similar RSI pattern occurred in July 2008.
-1.3909 is possible resistance before the high. If the rate does trade to a new high, then a drop back into the range would be required in order to create a tradable high. It’s worth mentioning that important tops have formed in April/May in recent years. A 1.3750 break would ‘announce’ that a downtrend has commenced.
GBP/USD
Monthly
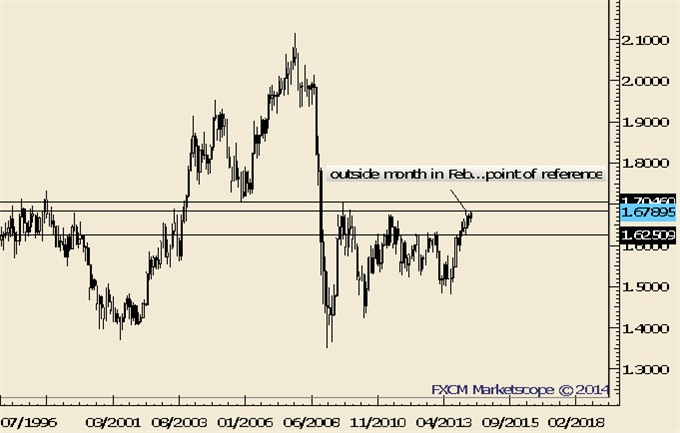
Chart Prepared by Jamie Saettele, CMT using Marketscope 2.0
Automate trades with Mirror Trader
-GBPUSD upside pressures remain intact. The line that extends off of the November and February lows pinpointed the 3/24 low and a break of the support line would suggest that February’s outside month was exhaustive.
-The momentum profile described regarding EURUSD applies to GBPUSD too. In fact, daily RSI hasn’t been above 70 since the October top. Don’t forget about extreme COT readings.
AUD/USD
Weekly
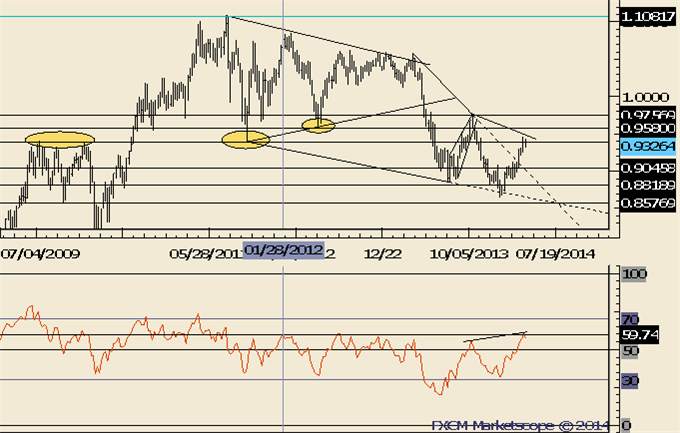
Chart Prepared by Jamie Saettele, CMT using Marketscope 2.0
Automate trades with Mirror Trader
-AUDUSD made an inside week at resistance from the 2009 high, 2011 low and late November low. Weekly RSI has turned over from near 60, which has been resistance in the indicator since January 2012. This is a good place for a sharp decline if not the resumption of the longer term downtrend.
NZD/USD
Monthly

Chart Prepared by Jamie Saettele, CMT using Marketscope 2.0
Automate trades with Mirror Trader
-NZDUSD completely retraced last week’s advance. I’m treating the April 10th high as a major top.
-Don’t forget about the line that extends off of the 1996 and 2007 highs. That line crosses through the 2008, 2011, and highs as well. In 2011 (record free float high), the rate surged through the line in late July before topping on August 1st.
USD/JPY
Monthly

Chart Prepared by Jamie Saettele, CMT using Marketscope 2.0
Automate trades with Mirror Trader
-USDJPY has bounced from the line that extends off of the February and 3/14 lows. The rally from the February low channels in a corrective manner and makes 104.12 important from a bigger picture bearish perspective.
-There is an Elliott case to be made for a return to the 4thwave of one less degree. The range spans 93.78 to 96.55. Of course, the path to get to that level is far from clear. Resistance extends into 103.05/25.
USD/CAD
Monthly
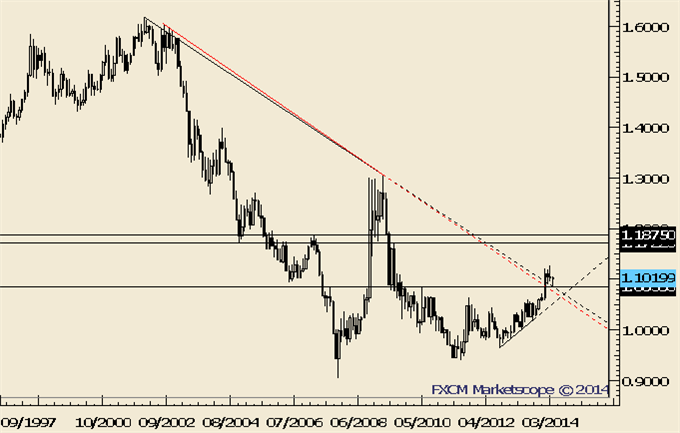
Chart Prepared by Jamie Saettele, CMT using Marketscope 2.0
Automate trades with Mirror Trader
-Measured objectives from the breakout above the 2011 high range from 1.1680 to 1.1910. The Jul 2009 high rests in this zone at 1.1724 and the 2007 high is near the top of the zone at 1.1875.
-From an Elliott perspective, it’s possible that the rally from the 2012 low composes a ‘3rd of a 3rd (or C)’ wave from the 2007 low.
-Action since the January high may compose a flat. The low at 1.0857 is in line with major inflection points on recent years as well as the 1/13 low (1.0842).
USD/CHF
Weekly
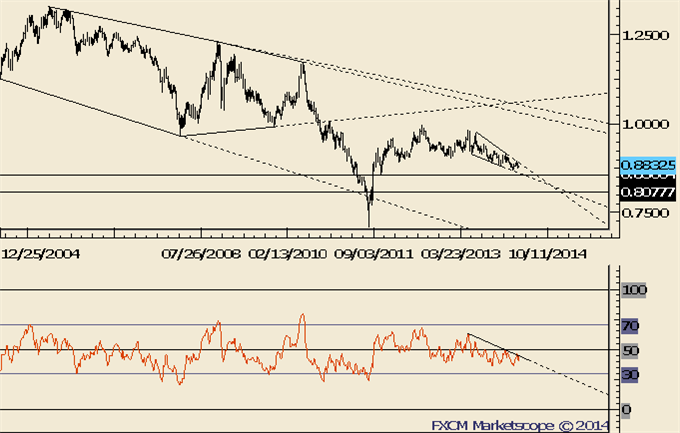
Chart Prepared by Jamie Saettele, CMT using Marketscope 2.0
Automate trades with Mirror Trader
-The same momentum considerations that apply to EURUSD apply to USDCHF (the March price low occurred with RSI above 30). Weekly RSI has been unable to register an ‘oversold’ reading despite the market declining for almost 2 years.
-Patter wise, the decline from the 2012 high ‘fits’ well as a 3 wave correction with wave C as an ending diagonal. When (if) this market turns is up in the air. In the event of new lows, watch .8566-.8640. Above .8844 begins to turn things constructive again.
DailyFX provides forex news and technical analysis on the trends that influence the global currency markets.
Learn forex trading with a free practice account and trading charts from FXCM.
