
 Yahoo Finance
 NZD/USD Forex Technical Analysis – Bullish Over .6952, Bearish Under .6914
The New Zealand Dollar closed slightly lower on Friday on relatively low volume and volatility. For a second day, the currency traded inside Thursday’s range. This suggests investor indecision and impending volatility.
The NZD/USD settled at .6916, down 0.0013 or -0.20%.
The longer-term fundamentals are bearish, but we could see a shift in the short-term fundamentals if U.S. Treasurys dip a little from their recent highs. Nonetheless, all rallies are likely to be sold at some point because of the divergence in monetary policies between the hawkish U.S. Federal Reserve and the dovish Reserve Bank of New Zealand.
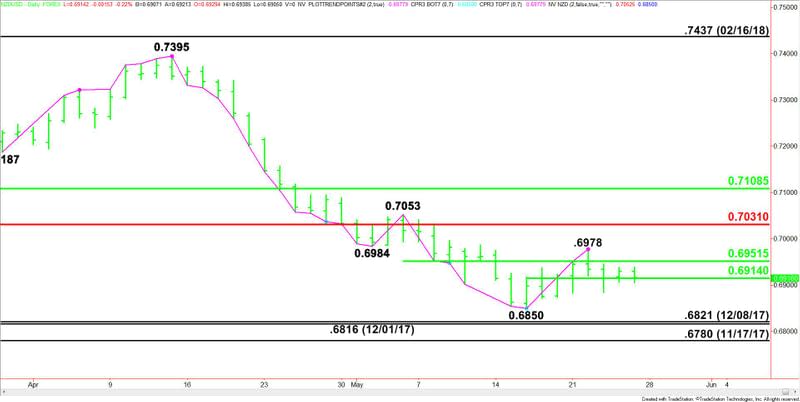
Daily Swing Chart Technical Analysis
The main trend is down according to the daily swing chart. However, momentum has been trending higher since the formation of the closing price reversal bottom on June 16 at .6850.
A trade through .6978 will indicate the buying is getting stronger. A move through .7053 will change the main trend to up. A move through .6850 will signal a resumption of the downtrend.
The short-term range is .6850 to .6978. Its 50% level or pivot at .6914 is controlling the direction of the Forex pair.
The intermediate range is .7053 to .6850. Its 50%: level or pivot at .6952 is acting like resistance.
The longer-term retracement zone at .7031 to .7109 is also resistance.
Daily Swing Chart Technical Forecast
Based on Friday’s close at .6916, the direction of the NZD/USD is likely to be determined by trader reaction to the short-term pivot at .6914.
A sustained move under .6914 will indicate the presence of sellers. If this move creates enough downside momentum, the selling could extend into the main bottom at .6850. This is followed by a series of old bottoms at .6821, .6816 and .6780.
A sustained move over .6914 will signal the presence of buyers. This could trigger a quick rally into .6952 and .6978. The latter is a possible trigger point for an acceleration into .7031 then .7053.
This article was originally posted on FX Empire
