
 Yahoo Finance
 Nu Skin Enterprises' (NYSE:NUS) Returns On Capital Not Reflecting Well On The Business
Did you know there are some financial metrics that can provide clues of a potential multi-bagger? Typically, we'll want to notice a trend of growing return on capital employed (ROCE) and alongside that, an expanding base of capital employed. Ultimately, this demonstrates that it's a business that is reinvesting profits at increasing rates of return. In light of that, when we looked at Nu Skin Enterprises (NYSE:NUS) and its ROCE trend, we weren't exactly thrilled.
What Is Return On Capital Employed (ROCE)?
For those that aren't sure what ROCE is, it measures the amount of pre-tax profits a company can generate from the capital employed in its business. The formula for this calculation on Nu Skin Enterprises is:
Return on Capital Employed = Earnings Before Interest and Tax (EBIT) ÷ (Total Assets - Current Liabilities)
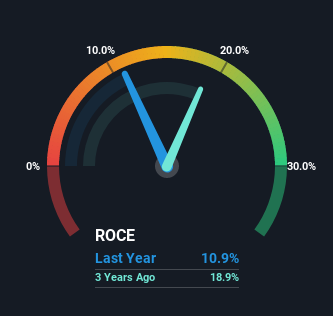
0.11 = US$159m ÷ (US$1.8b - US$359m) (Based on the trailing twelve months to December 2022).
Therefore, Nu Skin Enterprises has an ROCE of 11%. In absolute terms, that's a pretty standard return but compared to the Personal Products industry average it falls behind.
Check out our latest analysis for Nu Skin Enterprises
Above you can see how the current ROCE for Nu Skin Enterprises compares to its prior returns on capital, but there's only so much you can tell from the past. If you'd like, you can check out the forecasts from the analysts covering Nu Skin Enterprises here for free.
So How Is Nu Skin Enterprises' ROCE Trending?
On the surface, the trend of ROCE at Nu Skin Enterprises doesn't inspire confidence. To be more specific, ROCE has fallen from 24% over the last five years. And considering revenue has dropped while employing more capital, we'd be cautious. If this were to continue, you might be looking at a company that is trying to reinvest for growth but is actually losing market share since sales haven't increased.
Our Take On Nu Skin Enterprises' ROCE
We're a bit apprehensive about Nu Skin Enterprises because despite more capital being deployed in the business, returns on that capital and sales have both fallen. Long term shareholders who've owned the stock over the last five years have experienced a 36% depreciation in their investment, so it appears the market might not like these trends either. That being the case, unless the underlying trends revert to a more positive trajectory, we'd consider looking elsewhere.
Nu Skin Enterprises does have some risks though, and we've spotted 3 warning signs for Nu Skin Enterprises that you might be interested in.
While Nu Skin Enterprises isn't earning the highest return, check out this free list of companies that are earning high returns on equity with solid balance sheets.
Have feedback on this article? Concerned about the content? Get in touch with us directly. Alternatively, email editorial-team (at) simplywallst.com.
This article by Simply Wall St is general in nature. We provide commentary based on historical data and analyst forecasts only using an unbiased methodology and our articles are not intended to be financial advice. It does not constitute a recommendation to buy or sell any stock, and does not take account of your objectives, or your financial situation. We aim to bring you long-term focused analysis driven by fundamental data. Note that our analysis may not factor in the latest price-sensitive company announcements or qualitative material. Simply Wall St has no position in any stocks mentioned.
Join A Paid User Research Session
You’ll receive a US$30 Amazon Gift card for 1 hour of your time while helping us build better investing tools for the individual investors like yourself. Sign up here
