
 Yahoo Finance
 Not Many Are Piling Into De.mem Limited (ASX:DEM) Just Yet
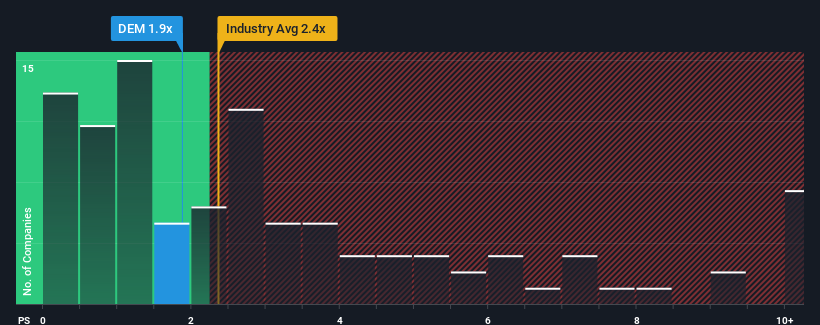
It's not a stretch to say that De.mem Limited's (ASX:DEM) price-to-sales (or "P/S") ratio of 1.9x right now seems quite "middle-of-the-road" for companies in the Water Utilities industry in Australia, where the median P/S ratio is around 2.4x. While this might not raise any eyebrows, if the P/S ratio is not justified investors could be missing out on a potential opportunity or ignoring looming disappointment.
Check out our latest analysis for De.mem
How Has De.mem Performed Recently?
Revenue has risen firmly for De.mem recently, which is pleasing to see. It might be that many expect the respectable revenue performance to wane, which has kept the P/S from rising. If you like the company, you'd be hoping this isn't the case so that you could potentially pick up some stock while it's not quite in favour.
We don't have analyst forecasts, but you can see how recent trends are setting up the company for the future by checking out our free report on De.mem's earnings, revenue and cash flow.
Is There Some Revenue Growth Forecasted For De.mem?
There's an inherent assumption that a company should be matching the industry for P/S ratios like De.mem's to be considered reasonable.
If we review the last year of revenue growth, the company posted a worthy increase of 8.7%. This was backed up an excellent period prior to see revenue up by 94% in total over the last three years. Accordingly, shareholders would have definitely welcomed those medium-term rates of revenue growth.
This is in contrast to the rest of the industry, which is expected to grow by 9.9% over the next year, materially lower than the company's recent medium-term annualised growth rates.
With this information, we find it interesting that De.mem is trading at a fairly similar P/S compared to the industry. It may be that most investors are not convinced the company can maintain its recent growth rates.
The Key Takeaway
Typically, we'd caution against reading too much into price-to-sales ratios when settling on investment decisions, though it can reveal plenty about what other market participants think about the company.
To our surprise, De.mem revealed its three-year revenue trends aren't contributing to its P/S as much as we would have predicted, given they look better than current industry expectations. There could be some unobserved threats to revenue preventing the P/S ratio from matching this positive performance. At least the risk of a price drop looks to be subdued if recent medium-term revenue trends continue, but investors seem to think future revenue could see some volatility.
Don't forget that there may be other risks. For instance, we've identified 2 warning signs for De.mem that you should be aware of.
If these risks are making you reconsider your opinion on De.mem, explore our interactive list of high quality stocks to get an idea of what else is out there.
Have feedback on this article? Concerned about the content? Get in touch with us directly. Alternatively, email editorial-team (at) simplywallst.com.
This article by Simply Wall St is general in nature. We provide commentary based on historical data and analyst forecasts only using an unbiased methodology and our articles are not intended to be financial advice. It does not constitute a recommendation to buy or sell any stock, and does not take account of your objectives, or your financial situation. We aim to bring you long-term focused analysis driven by fundamental data. Note that our analysis may not factor in the latest price-sensitive company announcements or qualitative material. Simply Wall St has no position in any stocks mentioned.
Join A Paid User Research Session
You’ll receive a US$30 Amazon Gift card for 1 hour of your time while helping us build better investing tools for the individual investors like yourself. Sign up here
