
 Yahoo Finance
 Update: Nordson (NASDAQ:NDSN) Stock Gained 96% In The Last Five Years

Want to participate in a short research study? Help shape the future of investing tools and you could win a $250 gift card!
Stock pickers are generally looking for stocks that will outperform the broader market. And in our experience, buying the right stocks can give your wealth a significant boost. For example, the Nordson Corporation (NASDAQ:NDSN) share price is up 96% in the last 5 years, clearly besting than the market return of around 47% (ignoring dividends). On the other hand, the more recent gains haven't been so impressive, with shareholders gaining just 15%, including dividends.
Check out our latest analysis for Nordson
In his essay The Superinvestors of Graham-and-Doddsville Warren Buffett described how share prices do not always rationally reflect the value of a business. By comparing earnings per share (EPS) and share price changes over time, we can get a feel for how investor attitudes to a company have morphed over time.
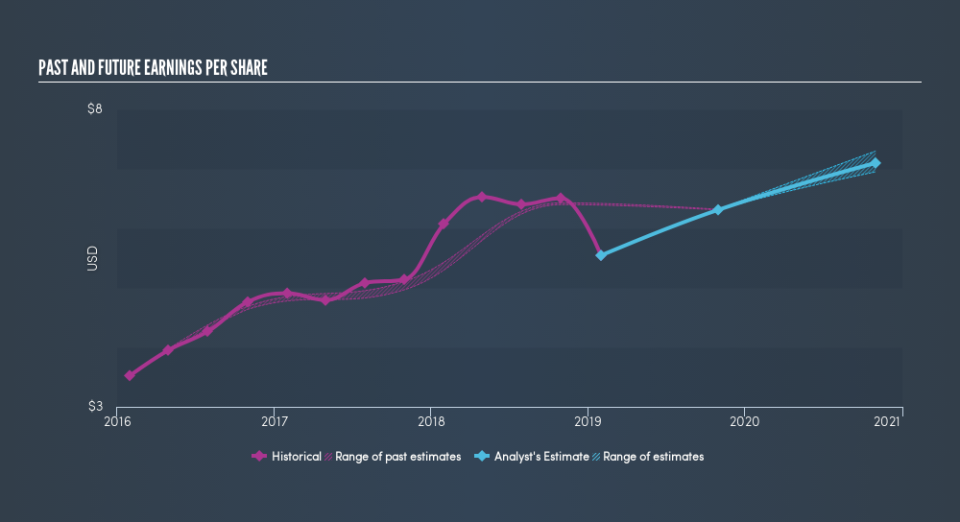
Over half a decade, Nordson managed to grow its earnings per share at 11% a year. This EPS growth is lower than the 14% average annual increase in the share price. This suggests that market participants hold the company in higher regard, these days. And that's hardly shocking given the track record of growth.
You can see how EPS has changed over time in the image below (click on the chart to see the exact values).
Dive deeper into Nordson's key metrics by checking this interactive graph of Nordson's earnings, revenue and cash flow.
What About Dividends?
As well as measuring the share price return, investors should also consider the total shareholder return (TSR). Whereas the share price return only reflects the change in the share price, the TSR includes the value of dividends (assuming they were reinvested) and the benefit of any discounted capital raising or spin-off. So for companies that pay a generous dividend, the TSR is often a lot higher than the share price return. As it happens, Nordson's TSR for the last 5 years was 107%, which exceeds the share price return mentioned earlier. And there's no prize for guessing that the dividend payments largely explain the divergence!
A Different Perspective
It's nice to see that Nordson shareholders have received a total shareholder return of 15% over the last year. That's including the dividend. However, the TSR over five years, coming in at 16% per year, is even more impressive. Before spending more time on Nordson it might be wise to click here to see if insiders have been buying or selling shares.
We will like Nordson better if we see some big insider buys. While we wait, check out this free list of growing companies with considerable, recent, insider buying.
Please note, the market returns quoted in this article reflect the market weighted average returns of stocks that currently trade on US exchanges.
We aim to bring you long-term focused research analysis driven by fundamental data. Note that our analysis may not factor in the latest price-sensitive company announcements or qualitative material.
If you spot an error that warrants correction, please contact the editor at editorial-team@simplywallst.com. This article by Simply Wall St is general in nature. It does not constitute a recommendation to buy or sell any stock, and does not take account of your objectives, or your financial situation. Simply Wall St has no position in the stocks mentioned. Thank you for reading.
