
 Yahoo Finance
 Is Nine Entertainment Co Holdings Limited’s (ASX:NEC) Balance Sheet A Threat To Its Future?

Nine Entertainment Co Holdings Limited (ASX:NEC) is a small-cap stock with a market capitalization of AU$2.18b. While investors primarily focus on the growth potential and competitive landscape of the small-cap companies, they end up ignoring a key aspect, which could be the biggest threat to its existence: its financial health. Why is it important? Evaluating financial health as part of your investment thesis is essential, as mismanagement of capital can lead to bankruptcies, which occur at a higher rate for small-caps. Here are few basic financial health checks you should consider before taking the plunge. Nevertheless, I know these factors are very high-level, so I’d encourage you to dig deeper yourself into NEC here.
Does NEC produce enough cash relative to debt?
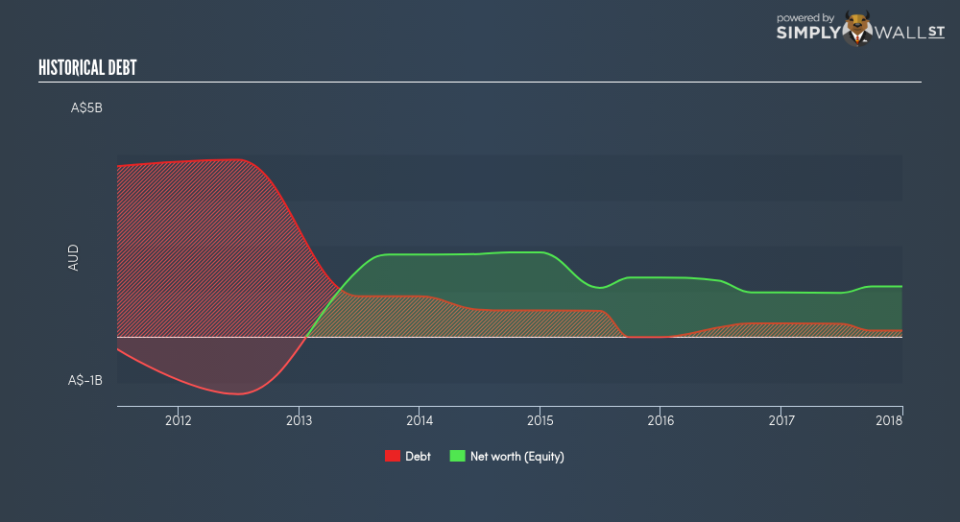
NEC’s debt levels surged from AU$220.49m to AU$291.18m over the last 12 months , which is made up of current and long term debt. With this growth in debt, NEC’s cash and short-term investments stands at AU$66.70m , ready to deploy into the business. Moving onto cash from operations, its small level of operating cash flow means calculating cash-to-debt wouldn’t be too useful, though these low levels of cash means that operational efficiency is worth a look. For this article’s sake, I won’t be looking at this today, but you can assess some of NEC’s operating efficiency ratios such as ROA here.
Does NEC’s liquid assets cover its short-term commitments?
Looking at NEC’s most recent AU$318.87m liabilities, the company has been able to meet these obligations given the level of current assets of AU$607.39m, with a current ratio of 1.9x. Usually, for Media companies, this is a suitable ratio since there is a bit of a cash buffer without leaving too much capital in a low-return environment.
Does NEC face the risk of succumbing to its debt-load?
With a debt-to-equity ratio of 12.96%, NEC’s debt level may be seen as prudent. This range is considered safe as NEC is not taking on too much debt obligation, which can be restrictive and risky for equity-holders. We can check to see whether NEC is able to meet its debt obligations by looking at the net interest coverage ratio. A company generating earnings before interest and tax (EBIT) at least three times its net interest payments is considered financially sound. In NEC’s, case, the ratio of 24.96x suggests that interest is comfortably covered, which means that debtors may be willing to loan the company more money, giving NEC ample headroom to grow its debt facilities.
Next Steps:
NEC’s low debt is also met with low coverage. This indicates room for improvement as its cash flow covers less than a quarter of its borrowings, which means its operating efficiency could be better. However, the company exhibits an ability to meet its near term obligations should an adverse event occur. Keep in mind I haven’t considered other factors such as how NEC has been performing in the past. I suggest you continue to research Nine Entertainment Holdings to get a better picture of the stock by looking at:
Future Outlook: What are well-informed industry analysts predicting for NEC’s future growth? Take a look at our free research report of analyst consensus for NEC’s outlook.
Valuation: What is NEC worth today? Is the stock undervalued, even when its growth outlook is factored into its intrinsic value? The intrinsic value infographic in our free research report helps visualize whether NEC is currently mispriced by the market.
Other High-Performing Stocks: Are there other stocks that provide better prospects with proven track records? Explore our free list of these great stocks here.
To help readers see pass the short term volatility of the financial market, we aim to bring you a long-term focused research analysis purely driven by fundamental data. Note that our analysis does not factor in the latest price sensitive company announcements.
The author is an independent contributor and at the time of publication had no position in the stocks mentioned.
