
 Yahoo Finance
 NFON (ETR:NFN) shareholders have endured a 57% loss from investing in the stock three years ago
If you love investing in stocks you're bound to buy some losers. Long term NFON AG (ETR:NFN) shareholders know that all too well, since the share price is down considerably over three years. Unfortunately, they have held through a 57% decline in the share price in that time. Unfortunately the share price momentum is still quite negative, with prices down 17% in thirty days.
With that in mind, it's worth seeing if the company's underlying fundamentals have been the driver of long term performance, or if there are some discrepancies.
See our latest analysis for NFON
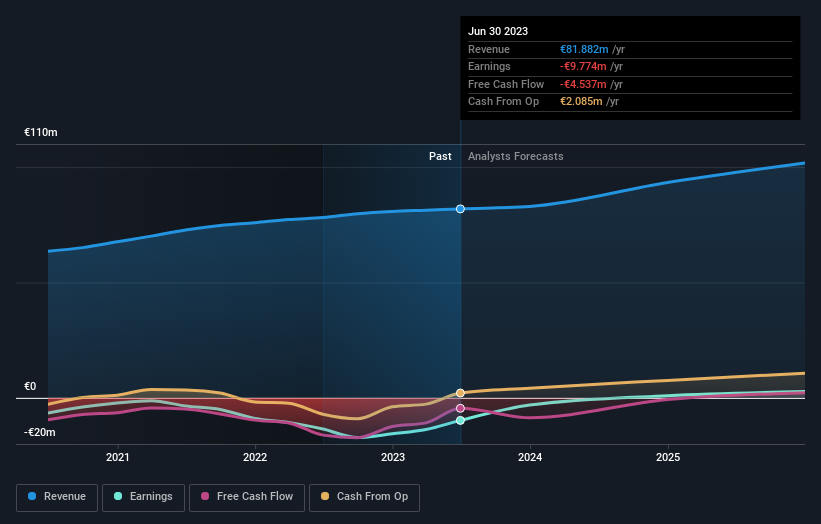
Because NFON made a loss in the last twelve months, we think the market is probably more focussed on revenue and revenue growth, at least for now. When a company doesn't make profits, we'd generally expect to see good revenue growth. That's because it's hard to be confident a company will be sustainable if revenue growth is negligible, and it never makes a profit.
In the last three years, NFON saw its revenue grow by 8.4% per year, compound. That's a pretty good rate of top-line growth. So some shareholders would be frustrated with the compound loss of 16% per year. To be frank we're surprised to see revenue growth and share price growth diverge so strongly. It would be well worth taking a closer look at the company, to determine growth trends (and balance sheet strength).
The image below shows how earnings and revenue have tracked over time (if you click on the image you can see greater detail).
Take a more thorough look at NFON's financial health with this free report on its balance sheet.
A Different Perspective
NFON shareholders are down 11% for the year, but the market itself is up 15%. Even the share prices of good stocks drop sometimes, but we want to see improvements in the fundamental metrics of a business, before getting too interested. However, the loss over the last year isn't as bad as the 9% per annum loss investors have suffered over the last half decade. We would want clear information suggesting the company will grow, before taking the view that the share price will stabilize. Shareholders might want to examine this detailed historical graph of past earnings, revenue and cash flow.
Of course NFON may not be the best stock to buy. So you may wish to see this free collection of growth stocks.
Please note, the market returns quoted in this article reflect the market weighted average returns of stocks that currently trade on German exchanges.
Have feedback on this article? Concerned about the content? Get in touch with us directly. Alternatively, email editorial-team (at) simplywallst.com.
This article by Simply Wall St is general in nature. We provide commentary based on historical data and analyst forecasts only using an unbiased methodology and our articles are not intended to be financial advice. It does not constitute a recommendation to buy or sell any stock, and does not take account of your objectives, or your financial situation. We aim to bring you long-term focused analysis driven by fundamental data. Note that our analysis may not factor in the latest price-sensitive company announcements or qualitative material. Simply Wall St has no position in any stocks mentioned.
