
 Yahoo Finance
 NEXTDC (ASX:NXT) Hasn't Managed To Accelerate Its Returns
To find a multi-bagger stock, what are the underlying trends we should look for in a business? Typically, we'll want to notice a trend of growing return on capital employed (ROCE) and alongside that, an expanding base of capital employed. Put simply, these types of businesses are compounding machines, meaning they are continually reinvesting their earnings at ever-higher rates of return. Having said that, from a first glance at NEXTDC (ASX:NXT) we aren't jumping out of our chairs at how returns are trending, but let's have a deeper look.
Understanding Return On Capital Employed (ROCE)
For those that aren't sure what ROCE is, it measures the amount of pre-tax profits a company can generate from the capital employed in its business. To calculate this metric for NEXTDC, this is the formula:
Return on Capital Employed = Earnings Before Interest and Tax (EBIT) ÷ (Total Assets - Current Liabilities)
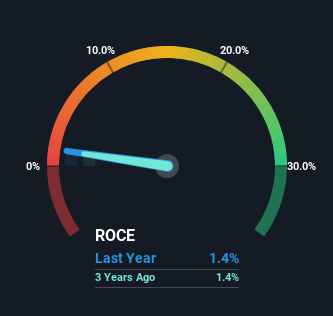
0.014 = AU$53m ÷ (AU$3.8b - AU$87m) (Based on the trailing twelve months to December 2023).
Therefore, NEXTDC has an ROCE of 1.4%. In absolute terms, that's a low return and it also under-performs the IT industry average of 7.9%.
See our latest analysis for NEXTDC
Above you can see how the current ROCE for NEXTDC compares to its prior returns on capital, but there's only so much you can tell from the past. If you'd like to see what analysts are forecasting going forward, you should check out our free analyst report for NEXTDC .
What Can We Tell From NEXTDC's ROCE Trend?
There are better returns on capital out there than what we're seeing at NEXTDC. The company has employed 139% more capital in the last five years, and the returns on that capital have remained stable at 1.4%. Given the company has increased the amount of capital employed, it appears the investments that have been made simply don't provide a high return on capital.
In Conclusion...
In conclusion, NEXTDC has been investing more capital into the business, but returns on that capital haven't increased. Investors must think there's better things to come because the stock has knocked it out of the park, delivering a 203% gain to shareholders who have held over the last five years. But if the trajectory of these underlying trends continue, we think the likelihood of it being a multi-bagger from here isn't high.
One final note, you should learn about the 3 warning signs we've spotted with NEXTDC (including 1 which is a bit concerning) .
While NEXTDC may not currently earn the highest returns, we've compiled a list of companies that currently earn more than 25% return on equity. Check out this free list here.
Have feedback on this article? Concerned about the content? Get in touch with us directly. Alternatively, email editorial-team (at) simplywallst.com.
This article by Simply Wall St is general in nature. We provide commentary based on historical data and analyst forecasts only using an unbiased methodology and our articles are not intended to be financial advice. It does not constitute a recommendation to buy or sell any stock, and does not take account of your objectives, or your financial situation. We aim to bring you long-term focused analysis driven by fundamental data. Note that our analysis may not factor in the latest price-sensitive company announcements or qualitative material. Simply Wall St has no position in any stocks mentioned.
