
 Yahoo Finance
 Two charts Aussies in property need to track


Do you want to know what’s happening to the property markets right now?
How do you keep track of a market that changes on a daily basis?
Related story: How international property markets are responding to Covid-19
Related story: The properties you can score a 10% discount on
In the good old days (remember them) a real time index was auction clearance results, which were particularly relevant for Melbourne and Sydney, but that’s an irrelevant statistic today isn’t it?
The second most commonly quoted statistic was median prices, but again, how relevant are they today?
Firstly, they’re a lagging indicator telling us what happened a while ago and secondly with fewer sales occurring, how indicative are median prices of intrinsic property values?
Especially since most property transactions are from more desperate non-discretionary buyers and sellers.
But recently, Dr Andrew Wilson, Chief Economist of MyHousingMarket.com.au has devised a new index that should give us a better indication of what’s really happening in the market.
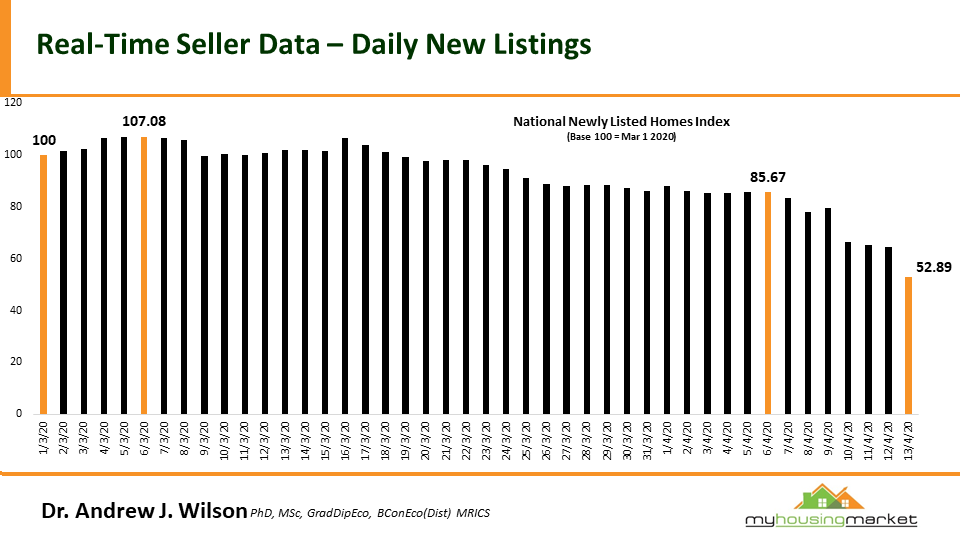
New Listings Index
As opposed to previously quoted indexes which quote the total number of properties currently on the market, Dr Wilson has developed a New Listings Index, which reports the number of new properties that are put on the market for sale each day and reports this weekly.
This is a ‘real time’ indication of vendor current vendors’ sentiment.
Using 1st March 2020, before social justice thing was strictly enforced, as a baseline of 100, the following chart shows the number of new properties listed for sale has fallen by almost 50 per cent.
No surprise here. Discretionary sellers are on strike at present, waiting to see what’s going to happen to the markets.
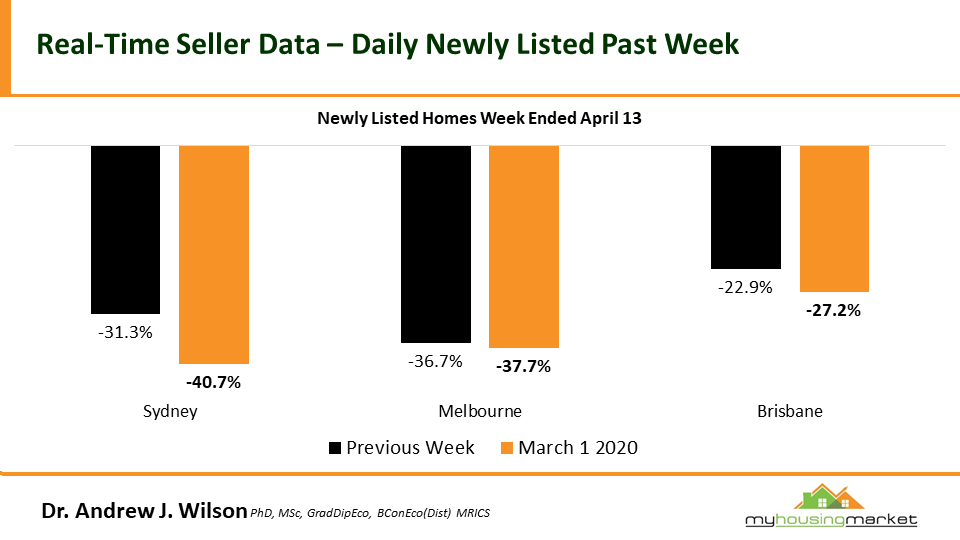
Obviously the trend is going to be more important than individual numbers, but the chart below shows the dearth of new properties coming on the market over the last week.
Sure, there were seasonal factors involved being Easter, but new listings are still 20 per cent lower than for the week after Easter last year.
What’s happening to asking prices?
Another useful real time index is ‘Asking Prices’.
In the past, asking prices have proven to be an accurate reflection of future sale prices, but give an indication of what’s happening in the current market, rather than having to wait 60 or 90 days for a property to be eventually sold and reported.
Currently, asking prices have had little movement, suggesting vendor confidence remains.
However it will be interesting to see how this holds up as the coronavirus lockdown infects consumer confidence and our property markets.


Michael Yardney is a director of Metropole Property Strategists, which creates wealth for its clients through independent, unbiased property advice and advocacy. He is a best-selling author, one of Australia's leading experts in wealth creation through property and writes the Property Update blog and hosts the popular Michael Yardney Podcast.
