
 Yahoo Finance
 Nevada Copper Corp. (TSE:NCU): When Will It Breakeven?
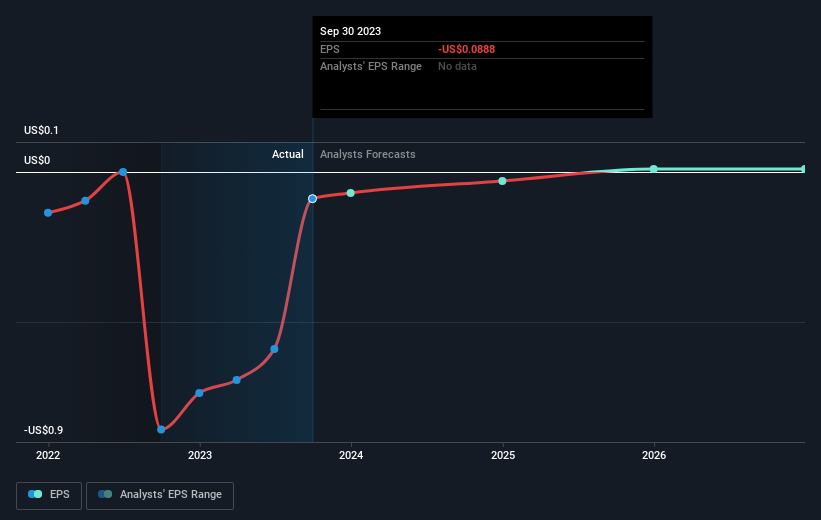
We feel now is a pretty good time to analyse Nevada Copper Corp.'s (TSE:NCU) business as it appears the company may be on the cusp of a considerable accomplishment. Nevada Copper Corp. engages in the exploration, development, and operation of mineral properties in Nevada. The CA$86m market-cap company’s loss lessened since it announced a US$358m loss in the full financial year, compared to the latest trailing-twelve-month loss of US$79m, as it approaches breakeven. The most pressing concern for investors is Nevada Copper's path to profitability – when will it breakeven? We've put together a brief outline of industry analyst expectations for the company, its year of breakeven and its implied growth rate.
Check out our latest analysis for Nevada Copper
Nevada Copper is bordering on breakeven, according to the 2 Canadian Metals and Mining analysts. They expect the company to post a final loss in 2024, before turning a profit of US$19m in 2025. So, the company is predicted to breakeven just over a year from today. In order to meet this breakeven date, we calculated the rate at which the company must grow year-on-year. It turns out an average annual growth rate of 71% is expected, which is extremely buoyant. If this rate turns out to be too aggressive, the company may become profitable much later than analysts predict.
Given this is a high-level overview, we won’t go into details of Nevada Copper's upcoming projects, however, take into account that typically metals and mining companies, depending on the stage of operation and metals mined, have irregular periods of cash flow. So, a high growth rate is not out of the ordinary, particularly when a company is in a period of investment.
One thing we would like to bring into light with Nevada Copper is its relatively high level of debt. Generally, the rule of thumb is debt shouldn’t exceed 40% of your equity, which in Nevada Copper's case is 77%. Note that a higher debt obligation increases the risk around investing in the loss-making company.
Next Steps:
There are too many aspects of Nevada Copper to cover in one brief article, but the key fundamentals for the company can all be found in one place – Nevada Copper's company page on Simply Wall St. We've also put together a list of pertinent aspects you should further research:
Valuation: What is Nevada Copper worth today? Has the future growth potential already been factored into the price? The intrinsic value infographic in our free research report helps visualize whether Nevada Copper is currently mispriced by the market.
Management Team: An experienced management team on the helm increases our confidence in the business – take a look at who sits on Nevada Copper’s board and the CEO’s background.
Other High-Performing Stocks: Are there other stocks that provide better prospects with proven track records? Explore our free list of these great stocks here.
Have feedback on this article? Concerned about the content? Get in touch with us directly. Alternatively, email editorial-team (at) simplywallst.com.
This article by Simply Wall St is general in nature. We provide commentary based on historical data and analyst forecasts only using an unbiased methodology and our articles are not intended to be financial advice. It does not constitute a recommendation to buy or sell any stock, and does not take account of your objectives, or your financial situation. We aim to bring you long-term focused analysis driven by fundamental data. Note that our analysis may not factor in the latest price-sensitive company announcements or qualitative material. Simply Wall St has no position in any stocks mentioned.
