
 Yahoo Finance
 NetEase (NASDAQ:NTES) Might Become A Compounding Machine
Finding a business that has the potential to grow substantially is not easy, but it is possible if we look at a few key financial metrics. Typically, we'll want to notice a trend of growing return on capital employed (ROCE) and alongside that, an expanding base of capital employed. This shows us that it's a compounding machine, able to continually reinvest its earnings back into the business and generate higher returns. With that in mind, the ROCE of NetEase (NASDAQ:NTES) looks attractive right now, so lets see what the trend of returns can tell us.
Understanding Return On Capital Employed (ROCE)
Just to clarify if you're unsure, ROCE is a metric for evaluating how much pre-tax income (in percentage terms) a company earns on the capital invested in its business. The formula for this calculation on NetEase is:
Return on Capital Employed = Earnings Before Interest and Tax (EBIT) ÷ (Total Assets - Current Liabilities)
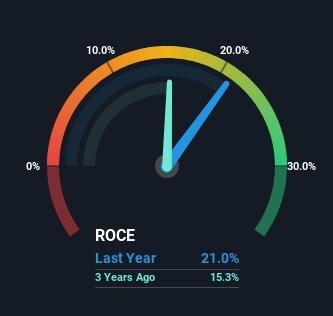
0.21 = CN¥28b ÷ (CN¥186b - CN¥54b) (Based on the trailing twelve months to December 2023).
Therefore, NetEase has an ROCE of 21%. That's a fantastic return and not only that, it outpaces the average of 9.1% earned by companies in a similar industry.
View our latest analysis for NetEase
In the above chart we have measured NetEase's prior ROCE against its prior performance, but the future is arguably more important. If you'd like to see what analysts are forecasting going forward, you should check out our free analyst report for NetEase .
How Are Returns Trending?
NetEase deserves to be commended in regards to it's returns. Over the past five years, ROCE has remained relatively flat at around 21% and the business has deployed 155% more capital into its operations. Now considering ROCE is an attractive 21%, this combination is actually pretty appealing because it means the business can consistently put money to work and generate these high returns. If NetEase can keep this up, we'd be very optimistic about its future.
On a side note, NetEase has done well to reduce current liabilities to 29% of total assets over the last five years. This can eliminate some of the risks inherent in the operations because the business has less outstanding obligations to their suppliers and or short-term creditors than they did previously.
In Conclusion...
NetEase has demonstrated its proficiency by generating high returns on increasing amounts of capital employed, which we're thrilled about. On top of that, the stock has rewarded shareholders with a remarkable 140% return to those who've held over the last five years. So even though the stock might be more "expensive" than it was before, we think the strong fundamentals warrant this stock for further research.
If you'd like to know about the risks facing NetEase, we've discovered 1 warning sign that you should be aware of.
If you want to search for more stocks that have been earning high returns, check out this free list of stocks with solid balance sheets that are also earning high returns on equity.
Have feedback on this article? Concerned about the content? Get in touch with us directly. Alternatively, email editorial-team (at) simplywallst.com.
This article by Simply Wall St is general in nature. We provide commentary based on historical data and analyst forecasts only using an unbiased methodology and our articles are not intended to be financial advice. It does not constitute a recommendation to buy or sell any stock, and does not take account of your objectives, or your financial situation. We aim to bring you long-term focused analysis driven by fundamental data. Note that our analysis may not factor in the latest price-sensitive company announcements or qualitative material. Simply Wall St has no position in any stocks mentioned.
