
 Yahoo Finance
 NAHL Group's (LON:NAH) Returns On Capital Not Reflecting Well On The Business
What financial metrics can indicate to us that a company is maturing or even in decline? Typically, we'll see the trend of both return on capital employed (ROCE) declining and this usually coincides with a decreasing amount of capital employed. Basically the company is earning less on its investments and it is also reducing its total assets. So after we looked into NAHL Group (LON:NAH), the trends above didn't look too great.
What is Return On Capital Employed (ROCE)?
For those who don't know, ROCE is a measure of a company's yearly pre-tax profit (its return), relative to the capital employed in the business. The formula for this calculation on NAHL Group is:
Return on Capital Employed = Earnings Before Interest and Tax (EBIT) ÷ (Total Assets - Current Liabilities)
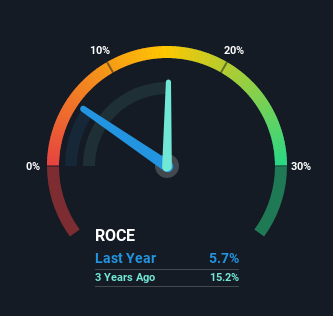
0.057 = UK£4.4m ÷ (UK£101m - UK£23m) (Based on the trailing twelve months to June 2021).
Therefore, NAHL Group has an ROCE of 5.7%. In absolute terms, that's a low return and it also under-performs the Media industry average of 8.6%.
See our latest analysis for NAHL Group
While the past is not representative of the future, it can be helpful to know how a company has performed historically, which is why we have this chart above. If you'd like to look at how NAHL Group has performed in the past in other metrics, you can view this free graph of past earnings, revenue and cash flow.
So How Is NAHL Group's ROCE Trending?
There is reason to be cautious about NAHL Group, given the returns are trending downwards. About five years ago, returns on capital were 24%, however they're now substantially lower than that as we saw above. And on the capital employed front, the business is utilizing roughly the same amount of capital as it was back then. This combination can be indicative of a mature business that still has areas to deploy capital, but the returns received aren't as high due potentially to new competition or smaller margins. If these trends continue, we wouldn't expect NAHL Group to turn into a multi-bagger.
What We Can Learn From NAHL Group's ROCE
In summary, it's unfortunate that NAHL Group is generating lower returns from the same amount of capital. Long term shareholders who've owned the stock over the last five years have experienced a 47% depreciation in their investment, so it appears the market might not like these trends either. With underlying trends that aren't great in these areas, we'd consider looking elsewhere.
If you'd like to know more about NAHL Group, we've spotted 2 warning signs, and 1 of them is significant.
If you want to search for solid companies with great earnings, check out this free list of companies with good balance sheets and impressive returns on equity.
Have feedback on this article? Concerned about the content? Get in touch with us directly. Alternatively, email editorial-team (at) simplywallst.com.
This article by Simply Wall St is general in nature. We provide commentary based on historical data and analyst forecasts only using an unbiased methodology and our articles are not intended to be financial advice. It does not constitute a recommendation to buy or sell any stock, and does not take account of your objectives, or your financial situation. We aim to bring you long-term focused analysis driven by fundamental data. Note that our analysis may not factor in the latest price-sensitive company announcements or qualitative material. Simply Wall St has no position in any stocks mentioned.
