
 Yahoo Finance
 Is MYOB Group Limited’s (ASX:MYO) Balance Sheet A Threat To Its Future?

Investors are always looking for growth in small-cap stocks like MYOB Group Limited (ASX:MYO), with a market cap of AU$1.65B. However, an important fact which most ignore is: how financially healthy is the business? Software companies, even ones that are profitable, are inclined towards being higher risk. So, understanding the company’s financial health becomes vital. Here are few basic financial health checks you should consider before taking the plunge. However, I know these factors are very high-level, so I suggest you dig deeper yourself into MYO here.
Does MYO generate enough cash through operations?
MYO’s debt level has been constant at around AU$432.99M over the previous year comprising of short- and long-term debt. At this current level of debt, MYO currently has AU$54.78M remaining in cash and short-term investments , ready to deploy into the business. Additionally, MYO has produced cash from operations of AU$163.92M over the same time period, resulting in an operating cash to total debt ratio of 37.86%, meaning that MYO’s current level of operating cash is high enough to cover debt. This ratio can also be interpreted as a measure of efficiency as an alternative to return on assets. In MYO’s case, it is able to generate 0.38x cash from its debt capital.
Can MYO pay its short-term liabilities?
With current liabilities at AU$100.75M, the company has not been able to meet these commitments with a current assets level of AU$100.36M, leading to a 1x current account ratio. which is under the appropriate industry ratio of 3x.
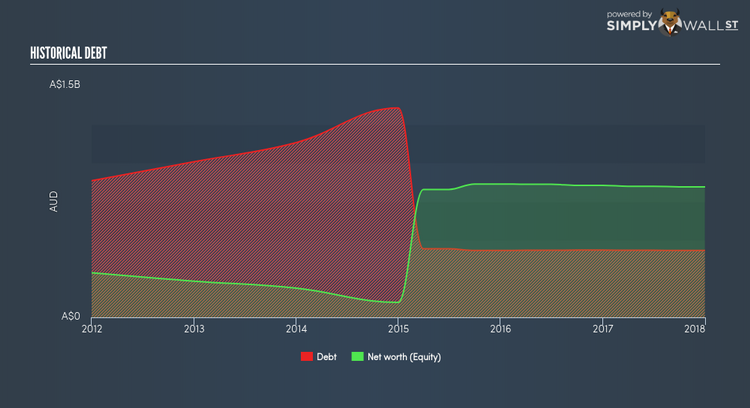
Does MYO face the risk of succumbing to its debt-load?
With a debt-to-equity ratio of 51.28%, MYO can be considered as an above-average leveraged company. This is not unusual for small-caps as debt tends to be a cheaper and faster source of funding for some businesses. We can check to see whether MYO is able to meet its debt obligations by looking at the net interest coverage ratio. A company generating earnings before interest and tax (EBIT) at least three times its net interest payments is considered financially sound. In MYO’s, case, the ratio of 8.28x suggests that interest is appropriately covered, which means that lenders may be less hesitant to lend out more funding as MYO’s high interest coverage is seen as responsible and safe practice.
Next Steps:
Although MYO’s debt level is towards the higher end of the spectrum, its cash flow coverage seems adequate to meet debt obligations which means its debt is being efficiently utilised. But, its low liquidity raises concerns over whether current asset management practices are properly implemented for the small-cap. This is only a rough assessment of financial health, and I’m sure MYO has company-specific issues impacting its capital structure decisions. You should continue to research MYOB Group to get a more holistic view of the stock by looking at:
Future Outlook: What are well-informed industry analysts predicting for MYO’s future growth? Take a look at our free research report of analyst consensus for MYO’s outlook.
Valuation: What is MYO worth today? Is the stock undervalued, even when its growth outlook is factored into its intrinsic value? The intrinsic value infographic in our free research report helps visualize whether MYO is currently mispriced by the market.
Other High-Performing Stocks: Are there other stocks that provide better prospects with proven track records? Explore our free list of these great stocks here.
To help readers see pass the short term volatility of the financial market, we aim to bring you a long-term focused research analysis purely driven by fundamental data. Note that our analysis does not factor in the latest price sensitive company announcements.
The author is an independent contributor and at the time of publication had no position in the stocks mentioned.
