
 Yahoo Finance
 What You Must Know About Melco International Development Limited's (HKG:200) Financial Strength

Mid-caps stocks, like Melco International Development Limited (HKG:200) with a market capitalization of HK$31b, aren’t the focus of most investors who prefer to direct their investments towards either large-cap or small-cap stocks. Despite this, the two other categories have lagged behind the risk-adjusted returns of commonly ignored mid-cap stocks. Today we will look at 200’s financial liquidity and debt levels, which are strong indicators for whether the company can weather economic downturns or fund strategic acquisitions for future growth. Remember this is a very top-level look that focuses exclusively on financial health, so I recommend a deeper analysis into 200 here.
Check out our latest analysis for Melco International Development
200’s Debt (And Cash Flows)
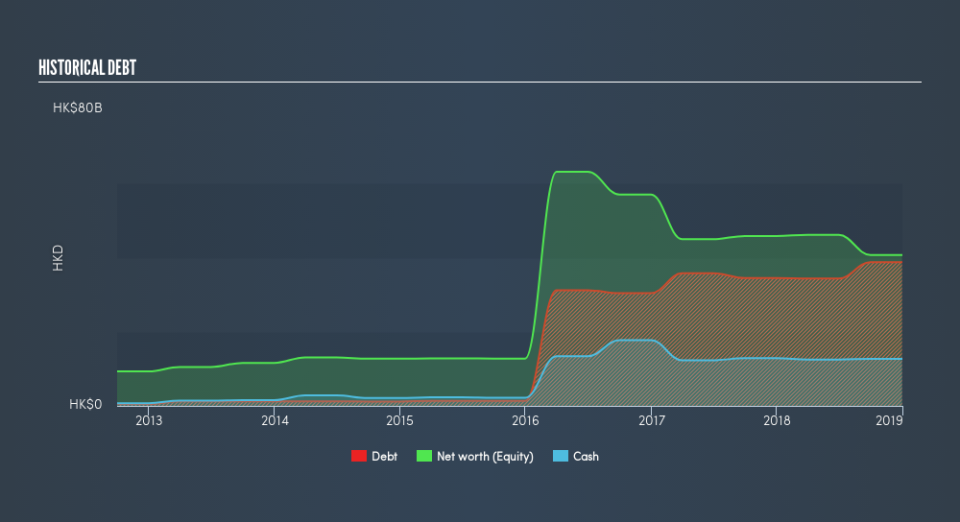
200's debt levels surged from HK$37b to HK$41b over the last 12 months , which includes long-term debt. With this increase in debt, 200's cash and short-term investments stands at HK$13b , ready to be used for running the business. Moreover, 200 has produced HK$10b in operating cash flow during the same period of time, resulting in an operating cash to total debt ratio of 25%, indicating that 200’s operating cash is sufficient to cover its debt.
Can 200 meet its short-term obligations with the cash in hand?
At the current liabilities level of HK$17b, it seems that the business arguably has a rather low level of current assets relative its obligations, with the current ratio last standing at 0.93x. The current ratio is the number you get when you divide current assets by current liabilities.
Is 200’s debt level acceptable?
With total debt exceeding equity, 200 is considered a highly levered company. This is not unusual for mid-caps as debt tends to be a cheaper and faster source of funding for some businesses. No matter how high the company’s debt, if it can easily cover the interest payments, it’s considered to be efficient with its use of excess leverage. A company generating earnings after interest and tax at least three times its net interest payments is considered financially sound. In 200's case, the ratio of 1.72x suggests that interest is not strongly covered, which means that debtors may be less inclined to loan the company more money, reducing its headroom for growth through debt.
Next Steps:
200’s high cash coverage means that, although its debt levels are high, the company is able to utilise its borrowings efficiently in order to generate cash flow. However, its lack of liquidity raises questions over current asset management practices for the mid-cap. Keep in mind I haven't considered other factors such as how 200 has been performing in the past. I recommend you continue to research Melco International Development to get a better picture of the stock by looking at:
Future Outlook: What are well-informed industry analysts predicting for 200’s future growth? Take a look at our free research report of analyst consensus for 200’s outlook.
Valuation: What is 200 worth today? Is the stock undervalued, even when its growth outlook is factored into its intrinsic value? The intrinsic value infographic in our free research report helps visualize whether 200 is currently mispriced by the market.
Other High-Performing Stocks: Are there other stocks that provide better prospects with proven track records? Explore our free list of these great stocks here.
We aim to bring you long-term focused research analysis driven by fundamental data. Note that our analysis may not factor in the latest price-sensitive company announcements or qualitative material.
If you spot an error that warrants correction, please contact the editor at editorial-team@simplywallst.com. This article by Simply Wall St is general in nature. It does not constitute a recommendation to buy or sell any stock, and does not take account of your objectives, or your financial situation. Simply Wall St has no position in the stocks mentioned. Thank you for reading.
