
 Yahoo Finance
 What You Must Know About CML Group Limited’s (ASX:CGR) Financial Strength

While small-cap stocks, such as CML Group Limited (ASX:CGR) with its market cap of AU$114.59m, are popular for their explosive growth, investors should also be aware of their balance sheet to judge whether the company can survive a downturn. So, understanding the company’s financial health becomes vital, since poor capital management may bring about bankruptcies, which occur at a higher rate for small-caps. I believe these basic checks tell most of the story you need to know. Nevertheless, since I only look at basic financial figures, I suggest you dig deeper yourself into CGR here.
Does CGR produce enough cash relative to debt?
CGR’s debt level has been constant at around AU$87.27m over the previous year made up of current and long term debt. At this constant level of debt, CGR currently has AU$14.93m remaining in cash and short-term investments , ready to deploy into the business. Moving onto cash from operations, its operating cash flow is not yet significant enough to calculate a meaningful cash-to-debt ratio, indicating that operational efficiency is something we’d need to take a look at. For this article’s sake, I won’t be looking at this today, but you can examine some of CGR’s operating efficiency ratios such as ROA here.
Does CGR’s liquid assets cover its short-term commitments?
Looking at CGR’s most recent AU$71.91m liabilities, it appears that the company has been able to meet these commitments with a current assets level of AU$147.27m, leading to a 2.05x current account ratio. For Professional Services companies, this ratio is within a sensible range as there’s enough of a cash buffer without holding too capital in low return investments.
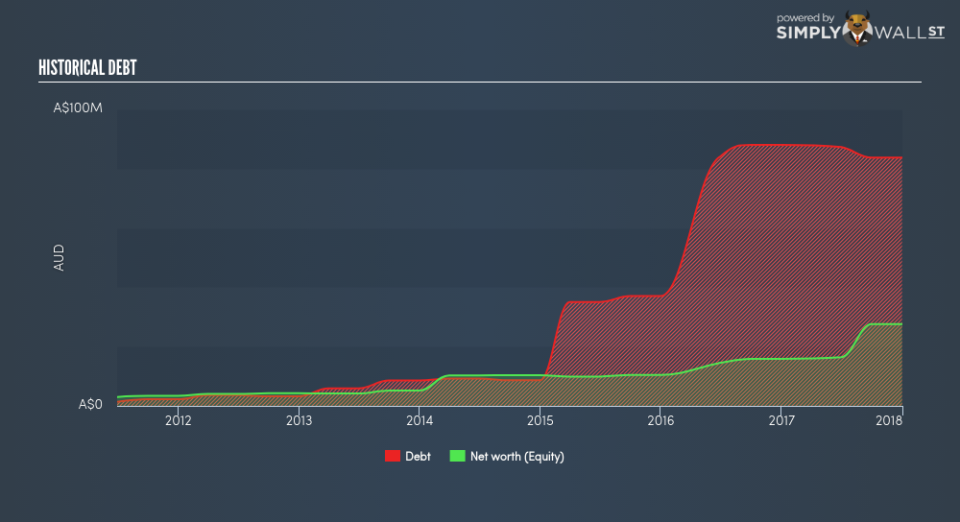
Can CGR service its debt comfortably?
Since total debt levels have outpaced equities, CGR is a highly leveraged company. This is not unusual for small-caps as debt tends to be a cheaper and faster source of funding for some businesses. We can test if CGR’s debt levels are sustainable by measuring interest payments against earnings of a company. Ideally, earnings before interest and tax (EBIT) should cover net interest by at least three times. For CGR, the ratio of 1.6x suggests that interest is not strongly covered, which means that lenders may refuse to lend the company more money, as it is seen as too risky in terms of default.
Next Steps:
CGR’s cash flow coverage indicates it could improve its operating efficiency in order to meet demand for debt repayments should unforeseen events arise. Though, the company exhibits proper management of current assets and upcoming liabilities. I admit this is a fairly basic analysis for CGR’s financial health. Other important fundamentals need to be considered alongside. I suggest you continue to research CML Group to get a better picture of the stock by looking at:
Future Outlook: What are well-informed industry analysts predicting for CGR’s future growth? Take a look at our free research report of analyst consensus for CGR’s outlook.
Valuation: What is CGR worth today? Is the stock undervalued, even when its growth outlook is factored into its intrinsic value? The intrinsic value infographic in our free research report helps visualize whether CGR is currently mispriced by the market.
Other High-Performing Stocks: Are there other stocks that provide better prospects with proven track records? Explore our free list of these great stocks here.
To help readers see pass the short term volatility of the financial market, we aim to bring you a long-term focused research analysis purely driven by fundamental data. Note that our analysis does not factor in the latest price sensitive company announcements.
The author is an independent contributor and at the time of publication had no position in the stocks mentioned.
