
 Yahoo Finance
 Mulberry Group (LON:MUL) investors are sitting on a loss of 70% if they invested five years ago
While not a mind-blowing move, it is good to see that the Mulberry Group plc (LON:MUL) share price has gained 16% in the last three months. But that can't change the reality that over the longer term (five years), the returns have been really quite dismal. The share price has failed to impress anyone , down a sizable 71% during that time. So we're not so sure if the recent bounce should be celebrated. But it could be that the fall was overdone.
It's worthwhile assessing if the company's economics have been moving in lockstep with these underwhelming shareholder returns, or if there is some disparity between the two. So let's do just that.
View our latest analysis for Mulberry Group
To quote Buffett, 'Ships will sail around the world but the Flat Earth Society will flourish. There will continue to be wide discrepancies between price and value in the marketplace...' One imperfect but simple way to consider how the market perception of a company has shifted is to compare the change in the earnings per share (EPS) with the share price movement.
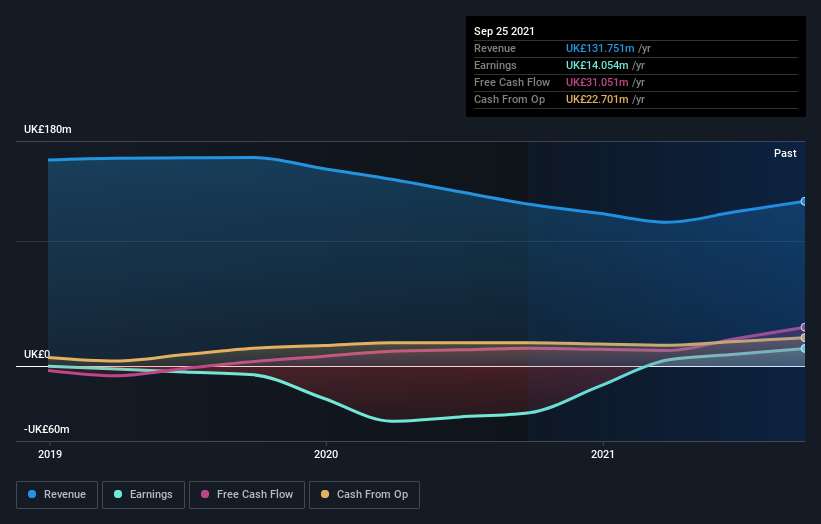
During five years of share price growth, Mulberry Group moved from a loss to profitability. That would generally be considered a positive, so we are surprised to see the share price is down. Other metrics may better explain the share price move.
It could be that the revenue decline of 6.5% per year is viewed as evidence that Mulberry Group is shrinking. That could explain the weak share price.
The image below shows how earnings and revenue have tracked over time (if you click on the image you can see greater detail).
This free interactive report on Mulberry Group's balance sheet strength is a great place to start, if you want to investigate the stock further.
A Different Perspective
We're pleased to report that Mulberry Group shareholders have received a total shareholder return of 22% over one year. Notably the five-year annualised TSR loss of 11% per year compares very unfavourably with the recent share price performance. We generally put more weight on the long term performance over the short term, but the recent improvement could hint at a (positive) inflection point within the business. I find it very interesting to look at share price over the long term as a proxy for business performance. But to truly gain insight, we need to consider other information, too. Consider for instance, the ever-present spectre of investment risk. We've identified 1 warning sign with Mulberry Group , and understanding them should be part of your investment process.
For those who like to find winning investments this free list of growing companies with recent insider purchasing, could be just the ticket.
Please note, the market returns quoted in this article reflect the market weighted average returns of stocks that currently trade on GB exchanges.
This article by Simply Wall St is general in nature. We provide commentary based on historical data and analyst forecasts only using an unbiased methodology and our articles are not intended to be financial advice. It does not constitute a recommendation to buy or sell any stock, and does not take account of your objectives, or your financial situation. We aim to bring you long-term focused analysis driven by fundamental data. Note that our analysis may not factor in the latest price-sensitive company announcements or qualitative material. Simply Wall St has no position in any stocks mentioned.
Have feedback on this article? Concerned about the content? Get in touch with us directly. Alternatively, email editorial-team (at) simplywallst.com.
