
 Yahoo Finance
 Is There More To Science Applications International Corporation (NYSE:SAIC) Than Its 9.5% Returns On Capital?

Today we'll look at Science Applications International Corporation (NYSE:SAIC) and reflect on its potential as an investment. Specifically, we'll consider its Return On Capital Employed (ROCE), since that will give us an insight into how efficiently the business can generate profits from the capital it requires.
First, we'll go over how we calculate ROCE. Then we'll compare its ROCE to similar companies. Finally, we'll look at how its current liabilities affect its ROCE.
What is Return On Capital Employed (ROCE)?
ROCE is a measure of a company's yearly pre-tax profit (its return), relative to the capital employed in the business. Generally speaking a higher ROCE is better. Overall, it is a valuable metric that has its flaws. Renowned investment researcher Michael Mauboussin has suggested that a high ROCE can indicate that 'one dollar invested in the company generates value of more than one dollar'.
So, How Do We Calculate ROCE?
Analysts use this formula to calculate return on capital employed:
Return on Capital Employed = Earnings Before Interest and Tax (EBIT) ÷ (Total Assets - Current Liabilities)
Or for Science Applications International:
0.095 = US$343m ÷ (US$4.6b - US$1.0b) (Based on the trailing twelve months to May 2019.)
So, Science Applications International has an ROCE of 9.5%.
See our latest analysis for Science Applications International
Is Science Applications International's ROCE Good?
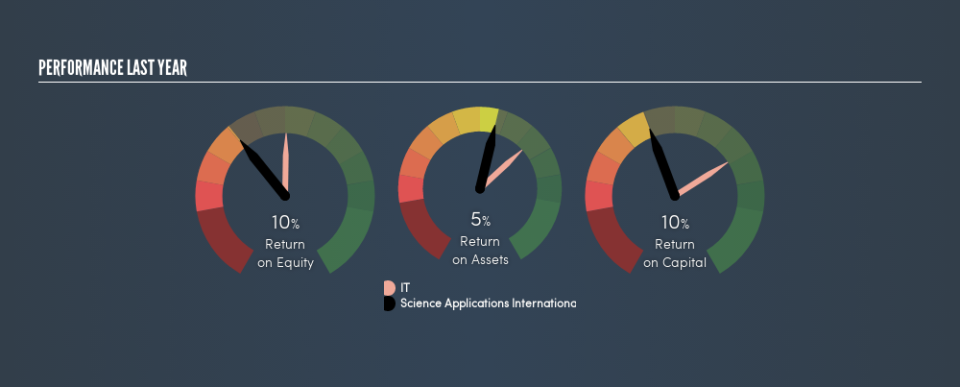
ROCE can be useful when making comparisons, such as between similar companies. It appears that Science Applications International's ROCE is fairly close to the IT industry average of 9.9%. Aside from the industry comparison, Science Applications International's ROCE is mediocre in absolute terms, considering the risk of investing in stocks versus the safety of a bank account. Investors may wish to consider higher-performing investments.
Science Applications International's current ROCE of 9.5% is lower than its ROCE in the past, which was 19%, 3 years ago. So investors might consider if it has had issues recently. The image below shows how Science Applications International's ROCE compares to its industry, and you can click it to see more detail on its past growth.
When considering this metric, keep in mind that it is backwards looking, and not necessarily predictive. Companies in cyclical industries can be difficult to understand using ROCE, as returns typically look high during boom times, and low during busts. ROCE is only a point-in-time measure. Future performance is what matters, and you can see analyst predictions in our free report on analyst forecasts for the company.
How Science Applications International's Current Liabilities Impact Its ROCE
Current liabilities are short term bills and invoices that need to be paid in 12 months or less. The ROCE equation subtracts current liabilities from capital employed, so a company with a lot of current liabilities appears to have less capital employed, and a higher ROCE than otherwise. To check the impact of this, we calculate if a company has high current liabilities relative to its total assets.
Science Applications International has total liabilities of US$1.0b and total assets of US$4.6b. As a result, its current liabilities are equal to approximately 22% of its total assets. This very reasonable level of current liabilities would not boost the ROCE by much.
The Bottom Line On Science Applications International's ROCE
With that in mind, we're not overly impressed with Science Applications International's ROCE, so it may not be the most appealing prospect. You might be able to find a better investment than Science Applications International. If you want a selection of possible winners, check out this free list of interesting companies that trade on a P/E below 20 (but have proven they can grow earnings).
If you are like me, then you will not want to miss this free list of growing companies that insiders are buying.
We aim to bring you long-term focused research analysis driven by fundamental data. Note that our analysis may not factor in the latest price-sensitive company announcements or qualitative material.
If you spot an error that warrants correction, please contact the editor at editorial-team@simplywallst.com. This article by Simply Wall St is general in nature. It does not constitute a recommendation to buy or sell any stock, and does not take account of your objectives, or your financial situation. Simply Wall St has no position in the stocks mentioned. Thank you for reading.
