
 Yahoo Finance
 Is There More To Oasis Petroleum Inc. (NYSE:OAS) Than Its 6.8% Returns On Capital?

Today we are going to look at Oasis Petroleum Inc. (NYSE:OAS) to see whether it might be an attractive investment prospect. In particular, we'll consider its Return On Capital Employed (ROCE), as that can give us insight into how profitably the company is able to employ capital in its business.
First, we'll go over how we calculate ROCE. Second, we'll look at its ROCE compared to similar companies. Last but not least, we'll look at what impact its current liabilities have on its ROCE.
What is Return On Capital Employed (ROCE)?
ROCE is a measure of a company's yearly pre-tax profit (its return), relative to the capital employed in the business. Generally speaking a higher ROCE is better. In brief, it is a useful tool, but it is not without drawbacks. Author Edwin Whiting says to be careful when comparing the ROCE of different businesses, since 'No two businesses are exactly alike.'
So, How Do We Calculate ROCE?
Analysts use this formula to calculate return on capital employed:
Return on Capital Employed = Earnings Before Interest and Tax (EBIT) ÷ (Total Assets - Current Liabilities)
Or for Oasis Petroleum:
0.068 = US$484m ÷ (US$7.7b - US$558m) (Based on the trailing twelve months to June 2019.)
So, Oasis Petroleum has an ROCE of 6.8%.
View our latest analysis for Oasis Petroleum
Does Oasis Petroleum Have A Good ROCE?
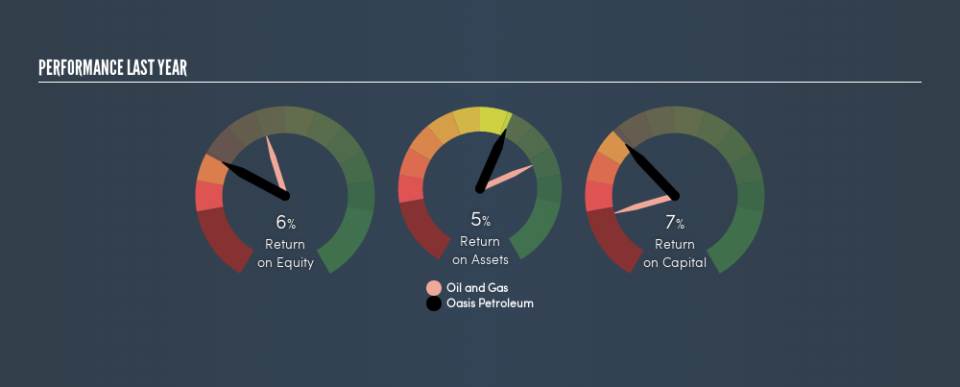
ROCE is commonly used for comparing the performance of similar businesses. It appears that Oasis Petroleum's ROCE is fairly close to the Oil and Gas industry average of 8.3%. Separate from how Oasis Petroleum stacks up against its industry, its ROCE in absolute terms is mediocre; relative to the returns on government bonds. It is possible that there are more rewarding investments out there.
Oasis Petroleum has an ROCE of 6.8%, but it didn't have an ROCE 3 years ago, since it was unprofitable. That suggests the business has returned to profitability. You can see in the image below how Oasis Petroleum's ROCE compares to its industry. Click to see more on past growth.
It is important to remember that ROCE shows past performance, and is not necessarily predictive. ROCE can be misleading for companies in cyclical industries, with returns looking impressive during the boom times, but very weak during the busts. ROCE is, after all, simply a snap shot of a single year. We note Oasis Petroleum could be considered a cyclical business. Future performance is what matters, and you can see analyst predictions in our free report on analyst forecasts for the company.
Do Oasis Petroleum's Current Liabilities Skew Its ROCE?
Current liabilities include invoices, such as supplier payments, short-term debt, or a tax bill, that need to be paid within 12 months. Due to the way ROCE is calculated, a high level of current liabilities makes a company look as though it has less capital employed, and thus can (sometimes unfairly) boost the ROCE. To counter this, investors can check if a company has high current liabilities relative to total assets.
Oasis Petroleum has total liabilities of US$558m and total assets of US$7.7b. As a result, its current liabilities are equal to approximately 7.2% of its total assets. Oasis Petroleum reports few current liabilities, which have a negligible impact on its unremarkable ROCE.
Our Take On Oasis Petroleum's ROCE
Based on this information, Oasis Petroleum appears to be a mediocre business. But note: make sure you look for a great company, not just the first idea you come across. So take a peek at this free list of interesting companies with strong recent earnings growth (and a P/E ratio below 20).
I will like Oasis Petroleum better if I see some big insider buys. While we wait, check out this free list of growing companies with considerable, recent, insider buying.
We aim to bring you long-term focused research analysis driven by fundamental data. Note that our analysis may not factor in the latest price-sensitive company announcements or qualitative material.
If you spot an error that warrants correction, please contact the editor at editorial-team@simplywallst.com. This article by Simply Wall St is general in nature. It does not constitute a recommendation to buy or sell any stock, and does not take account of your objectives, or your financial situation. Simply Wall St has no position in the stocks mentioned. Thank you for reading.
