
 Yahoo Finance
 MoneyGram International (NASDAQ:MGI) Shareholders Will Want The ROCE Trajectory To Continue
What are the early trends we should look for to identify a stock that could multiply in value over the long term? Typically, we'll want to notice a trend of growing return on capital employed (ROCE) and alongside that, an expanding base of capital employed. Basically this means that a company has profitable initiatives that it can continue to reinvest in, which is a trait of a compounding machine. So on that note, MoneyGram International (NASDAQ:MGI) looks quite promising in regards to its trends of return on capital.
What is Return On Capital Employed (ROCE)?
For those that aren't sure what ROCE is, it measures the amount of pre-tax profits a company can generate from the capital employed in its business. The formula for this calculation on MoneyGram International is:
Return on Capital Employed = Earnings Before Interest and Tax (EBIT) ÷ (Total Assets - Current Liabilities)
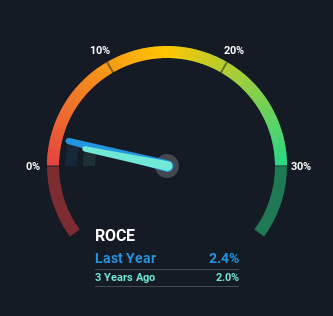
0.024 = US$104m ÷ (US$4.5b - US$104m) (Based on the trailing twelve months to June 2021).
So, MoneyGram International has an ROCE of 2.4%. Ultimately, that's a low return and it under-performs the IT industry average of 12%.
Check out our latest analysis for MoneyGram International
Above you can see how the current ROCE for MoneyGram International compares to its prior returns on capital, but there's only so much you can tell from the past. If you're interested, you can view the analysts predictions in our free report on analyst forecasts for the company.
How Are Returns Trending?
While there are companies with higher returns on capital out there, we still find the trend at MoneyGram International promising. Looking at the data, we can see that even though capital employed in the business has remained relatively flat, the ROCE generated has risen by 28% over the last five years. So our take on this is that the business has increased efficiencies to generate these higher returns, all the while not needing to make any additional investments. It's worth looking deeper into this though because while it's great that the business is more efficient, it might also mean that going forward the areas to invest internally for the organic growth are lacking.
What We Can Learn From MoneyGram International's ROCE
To bring it all together, MoneyGram International has done well to increase the returns it's generating from its capital employed. Investors may not be impressed by the favorable underlying trends yet because over the last five years the stock has only returned 14% to shareholders. So exploring more about this stock could uncover a good opportunity, if the valuation and other metrics stack up.
If you want to know some of the risks facing MoneyGram International we've found 4 warning signs (1 doesn't sit too well with us!) that you should be aware of before investing here.
For those who like to invest in solid companies, check out this free list of companies with solid balance sheets and high returns on equity.
This article by Simply Wall St is general in nature. We provide commentary based on historical data and analyst forecasts only using an unbiased methodology and our articles are not intended to be financial advice. It does not constitute a recommendation to buy or sell any stock, and does not take account of your objectives, or your financial situation. We aim to bring you long-term focused analysis driven by fundamental data. Note that our analysis may not factor in the latest price-sensitive company announcements or qualitative material. Simply Wall St has no position in any stocks mentioned.
Have feedback on this article? Concerned about the content? Get in touch with us directly. Alternatively, email editorial-team (at) simplywallst.com.
