
 Yahoo Finance
 MoneyGram International, Inc. (NASDAQ:MGI): Is Breakeven Near?
With the business potentially at an important milestone, we thought we'd take a closer look at MoneyGram International, Inc.'s (NASDAQ:MGI) future prospects. MoneyGram International, Inc., together with its subsidiaries, provides cross-border peer-to-peer payments and money transfer services in the United States and internationally. The company’s loss has recently broadened since it announced a US$7.9m loss in the full financial year, compared to the latest trailing-twelve-month loss of US$35m, moving it further away from breakeven. Many investors are wondering about the rate at which MoneyGram International will turn a profit, with the big question being “when will the company breakeven?” In this article, we will touch on the expectations for the company's growth and when analysts expect it to become profitable.
View our latest analysis for MoneyGram International
MoneyGram International is bordering on breakeven, according to the 5 American IT analysts. They expect the company to post a final loss in 2021, before turning a profit of US$49m in 2022. Therefore, the company is expected to breakeven just over a year from today. What rate will the company have to grow year-on-year in order to breakeven on this date? Using a line of best fit, we calculated an average annual growth rate of 110%, which is extremely buoyant. If this rate turns out to be too aggressive, the company may become profitable much later than analysts predict.
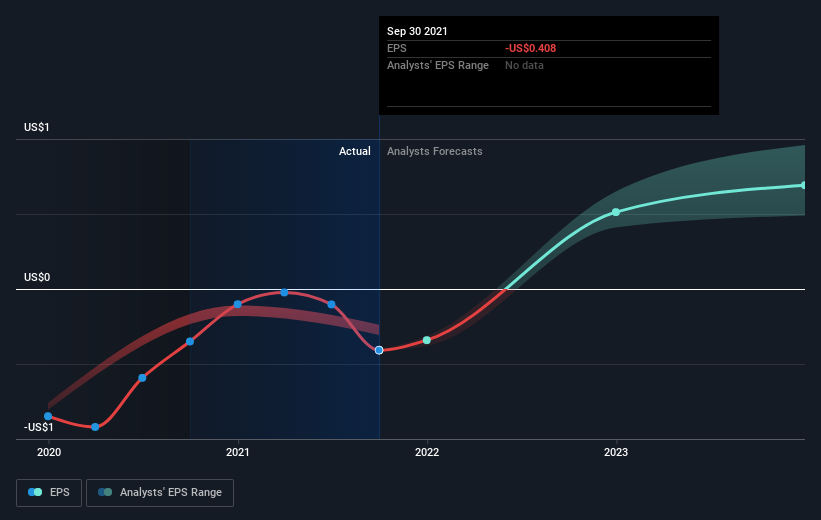
Given this is a high-level overview, we won’t go into details of MoneyGram International's upcoming projects, though, keep in mind that generally a high growth rate is not out of the ordinary, particularly when a company is in a period of investment.
One thing we would like to bring into light with MoneyGram International is it currently has negative equity on its balance sheet. This can sometimes arise from accounting methods used to deal with accumulated losses from prior years, which are viewed as liabilities carried forward until it cancels out in the future. These losses tend to occur only on paper, however, in other cases it can be forewarning.
Next Steps:
This article is not intended to be a comprehensive analysis on MoneyGram International, so if you are interested in understanding the company at a deeper level, take a look at MoneyGram International's company page on Simply Wall St. We've also put together a list of pertinent aspects you should further research:
Valuation: What is MoneyGram International worth today? Has the future growth potential already been factored into the price? The intrinsic value infographic in our free research report helps visualize whether MoneyGram International is currently mispriced by the market.
Management Team: An experienced management team on the helm increases our confidence in the business – take a look at who sits on MoneyGram International’s board and the CEO’s background.
Other High-Performing Stocks: Are there other stocks that provide better prospects with proven track records? Explore our free list of these great stocks here.
Have feedback on this article? Concerned about the content? Get in touch with us directly. Alternatively, email editorial-team (at) simplywallst.com.
This article by Simply Wall St is general in nature. We provide commentary based on historical data and analyst forecasts only using an unbiased methodology and our articles are not intended to be financial advice. It does not constitute a recommendation to buy or sell any stock, and does not take account of your objectives, or your financial situation. We aim to bring you long-term focused analysis driven by fundamental data. Note that our analysis may not factor in the latest price-sensitive company announcements or qualitative material. Simply Wall St has no position in any stocks mentioned.
