
 Yahoo Finance
 How Mineral Resources Limited (ASX:MIN) Delivered A Better ROE Than Its Industry

The content of this article will benefit those of you who are starting to educate yourself about investing in the stock market and want to begin learning the link between Mineral Resources Limited (ASX:MIN)’s return fundamentals and stock market performance.
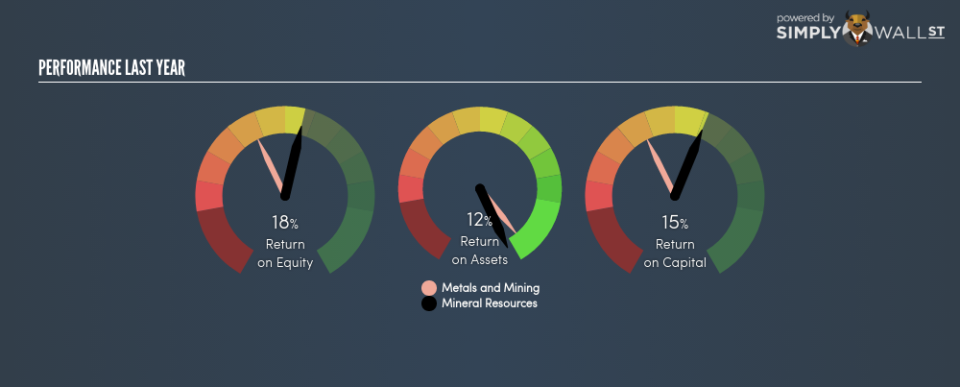
Mineral Resources Limited (ASX:MIN) delivered an ROE of 18.11% over the past 12 months, which is an impressive feat relative to its industry average of 11.89% during the same period. On the surface, this looks fantastic since we know that MIN has made large profits from little equity capital; however, ROE doesn’t tell us if management have borrowed heavily to make this happen. In this article, we’ll closely examine some factors like financial leverage to evaluate the sustainability of MIN’s ROE. See our latest analysis for Mineral Resources
What you must know about ROE
Return on Equity (ROE) is a measure of Mineral Resources’s profit relative to its shareholders’ equity. An ROE of 18.11% implies A$0.18 returned on every A$1 invested. While a higher ROE is preferred in most cases, there are several other factors we should consider before drawing any conclusions.
Return on Equity = Net Profit ÷ Shareholders Equity
ROE is assessed against cost of equity, which is measured using the Capital Asset Pricing Model (CAPM) – but let’s not dive into the details of that today. For now, let’s just look at the cost of equity number for Mineral Resources, which is 10.08%. This means Mineral Resources returns enough to cover its own cost of equity, with a buffer of 8.03%. This sustainable practice implies that the company pays less for its capital than what it generates in return. ROE can be split up into three useful ratios: net profit margin, asset turnover, and financial leverage. This is called the Dupont Formula:
Dupont Formula
ROE = profit margin × asset turnover × financial leverage
ROE = (annual net profit ÷ sales) × (sales ÷ assets) × (assets ÷ shareholders’ equity)
ROE = annual net profit ÷ shareholders’ equity
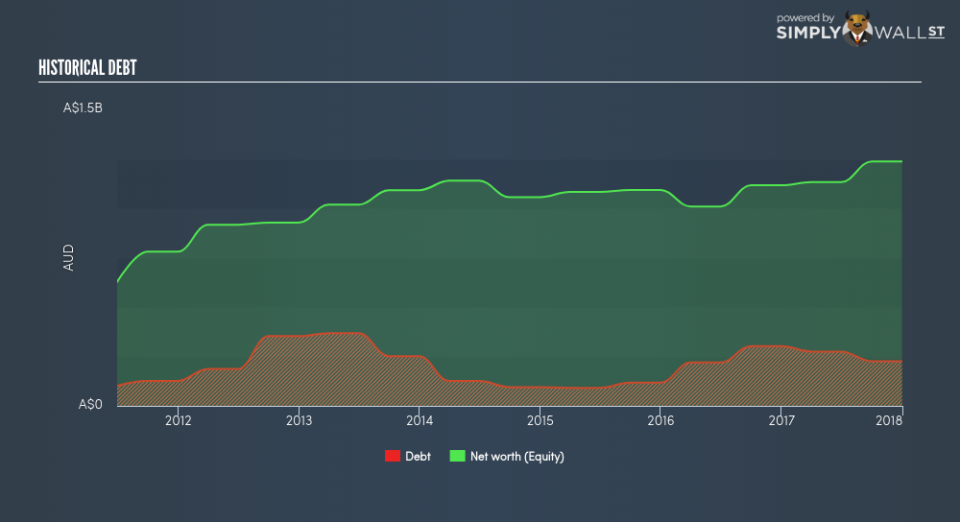
Basically, profit margin measures how much of revenue trickles down into earnings which illustrates how efficient the business is with its cost management. The other component, asset turnover, illustrates how much revenue Mineral Resources can make from its asset base. And finally, financial leverage is simply how much of assets are funded by equity, which exhibits how sustainable the company’s capital structure is. Since financial leverage can artificially inflate ROE, we need to look at how much debt Mineral Resources currently has. The debt-to-equity ratio currently stands at a low 18.24%, meaning the above-average ROE is due to its capacity to produce profit growth without a huge debt burden.
Next Steps:
ROE is a simple yet informative ratio, illustrating the various components that each measure the quality of the overall stock. Mineral Resources’s ROE is impressive relative to the industry average and also covers its cost of equity. Its high ROE is not likely to be driven by high debt. Therefore, investors may have more confidence in the sustainability of this level of returns going forward. Although ROE can be a useful metric, it is only a small part of diligent research.
For Mineral Resources, there are three fundamental factors you should further research:
Financial Health: Does it have a healthy balance sheet? Take a look at our free balance sheet analysis with six simple checks on key factors like leverage and risk.
Valuation: What is Mineral Resources worth today? Is the stock undervalued, even when its growth outlook is factored into its intrinsic value? The intrinsic value infographic in our free research report helps visualize whether Mineral Resources is currently mispriced by the market.
Other High-Growth Alternatives : Are there other high-growth stocks you could be holding instead of Mineral Resources? Explore our interactive list of stocks with large growth potential to get an idea of what else is out there you may be missing!
To help readers see pass the short term volatility of the financial market, we aim to bring you a long-term focused research analysis purely driven by fundamental data. Note that our analysis does not factor in the latest price sensitive company announcements.
The author is an independent contributor and at the time of publication had no position in the stocks mentioned.
