
 Yahoo Finance
 Mettler-Toledo (MTD) Q3 Earnings Top Estimates, Sales Up Y/Y
Mettler-Toledo International, Inc. MTD reported third-quarter 2019 adjusted earnings of $5.77 per share, beating the Zacks Consensus Estimate by 1.1% and also came ahead of management’s guided range of $5.65-$5.75 per share. The figure improved 13% on a year-over-year basis and 11.8% sequentially.
Net sales of $753.9 million were up 3% year over year and 3.1% from the previous quarter. The figure came in line with the Zacks Consensus Estimate.
Further, the top line improved 4% from the year-ago quarter in local currency. This matched the lower end of management’s guided range.
The robust performance of Laboratory and Industrial product lines drove the top line. Further, the company’s solid momentum across Americas, Europe and Asia contributed to the quarterly results.
However, unfavorable foreign exchange fluctuations and tariffs remained overhangs. Further, sluggishness in the food retail business continued to affect the results, without which net sales would have exhibited growth of 6% year over year in local currency.
Nevertheless, the company remains confident on growth strategies that include productivity and margin initiatives. Moreover, Mettler-Toledo’s continued investments in product portfolio expansion, field force, Spinnaker sales and marketing programs are expected to continue driving business.
Coming to the price performance, shares of Mettler-Toledo have gained 27.4% on a year-to-date basis, outperforming the industry’s rally of 19.1%.

Top Line in Detail
By Segments: The company reports in three segments — Laboratory Instruments, Industrial Instruments and Food Retail which accounted for 51%, 42% and 7% of the net sales in the third quarter, respectively. Further, Laboratory and Industrial segments witnessed year-over-year growth of 7% and 5% in the quarter under review, respectively.
However, Food Retail business was down significantly 15% from the year-ago quarter.
By Geography: The company reports total sales figure from Americas, Europe and Asia/Rest of the World. All these regions contributed 40%, 28% and 32% to the net sales in the third quarter, respectively. Further, sales in these regions went up 7%, 2% and 4% on a year-over-year basis, respectively.
Mettler-Toledo International, Inc. Price, Consensus and EPS Surprise
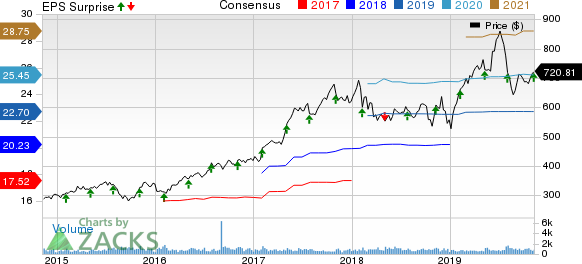
Mettler-Toledo International, Inc. price-consensus-eps-surprise-chart | Mettler-Toledo International, Inc. Quote
Operating Results
Gross margin was 57.7%, expanding 60 bps year over year.
Research & development (R&D) expenses were $36 million, up 3.4% from the year-ago quarter. Selling, general & administrative (SG&A) expenses increased 0.2% year over year to $202.8 million.
As a percentage of sales, R&D expenses expanded 10 bps year over year to 4.8%. However, SG&A expenses contracted 70 bps year over year to 26.9%.
Adjusted operating margin was 26%, which expanded 120 bps from the prior-year quarter.
Balance Sheet and Cash Flow
As of Sep 30, 2019, the company’s cash and cash equivalents balance was $120.5 million, down from $124.4 million as of Jun 30, 2019.
Long-term debt was $1.12 billion, increasing from $1.08 billion in the previous quarter.
Mettler-Toledo generated $175.9 million of cash from operating activities, up from $127.1 million in the prior quarter. Free cash flow was $151.6 million during the reported quarter.
Guidance
For fourth-quarter 2019, Mettler-Toledo anticipates sales growth of 3% on a year-over-year basis in local currency. The Zacks Consensus Estimate for sales is pegged at $845.96 million.
Adjusted earnings are anticipated in the range of $7.66-$7.71 per share, suggesting year-over-year growth of 12-13%. The Zacks Consensus Estimate for earnings is pegged at $7.77 per share.
For 2019, the company anticipates sales growth of 5% in local currency. The Zacks Consensus Estimate is pegged at $3.01 billion.
The company’s guidance for adjusted earnings lies in the range of $22.65-$22.70 per share. Notably, management has raised the lower end of the guidance, which stood at $22.60, but lowered the higher end that was $22.75 previously. Further, the bottom line is expected to indicate an improvement of 11-12% from the year-ago quarter.
The Zacks Consensus Estimate for earnings is pegged at $22.70 per share.
Zacks Rank & Key Picks
Mettler-Toledo currently has a Zacks Rank #4 (Sell).
Some better-ranked stocks in the broader technology sector worth considering are Alteryx, Inc. AYX, Instructure, Inc. INST and Fortinet, Inc. FTNT. All the three stocks flaunt a Zacks Rank #1 (Strong buy). You can see the complete list of today’s Zacks #1 Rank stocks here.
Long-term earnings growth rate for Alteryx, Instructure and Fortinet is currently pegged at 39.85%, 30% and 14%, respectively.
Today's Best Stocks from Zacks
Would you like to see the updated picks from our best market-beating strategies? From 2017 through 2018, while the S&P 500 gained +15.8%, five of our screens returned +38.0%, +61.3%, +61.6%, +68.1%, and +98.3%.
This outperformance has not just been a recent phenomenon. From 2000 – 2018, while the S&P averaged +4.8% per year, our top strategies averaged up to +56.2% per year.
See their latest picks free >>
Want the latest recommendations from Zacks Investment Research? Today, you can download 7 Best Stocks for the Next 30 Days. Click to get this free report
Fortinet, Inc. (FTNT) : Free Stock Analysis Report
Instructure, Inc. (INST) : Free Stock Analysis Report
Mettler-Toledo International, Inc. (MTD) : Free Stock Analysis Report
Alteryx, Inc. (AYX) : Free Stock Analysis Report
To read this article on Zacks.com click here.
Zacks Investment Research
