
 Yahoo Finance
 Metro Mining (ASX:MMI) Is Doing The Right Things To Multiply Its Share Price
There are a few key trends to look for if we want to identify the next multi-bagger. Typically, we'll want to notice a trend of growing return on capital employed (ROCE) and alongside that, an expanding base of capital employed. Put simply, these types of businesses are compounding machines, meaning they are continually reinvesting their earnings at ever-higher rates of return. So when we looked at Metro Mining (ASX:MMI) and its trend of ROCE, we really liked what we saw.
Return On Capital Employed (ROCE): What Is It?
For those that aren't sure what ROCE is, it measures the amount of pre-tax profits a company can generate from the capital employed in its business. To calculate this metric for Metro Mining, this is the formula:
Return on Capital Employed = Earnings Before Interest and Tax (EBIT) ÷ (Total Assets - Current Liabilities)
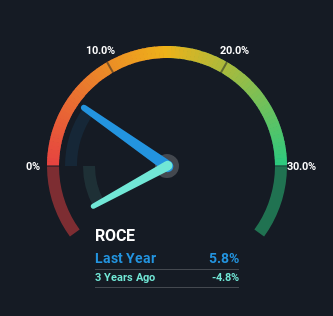
0.058 = AU$4.6m ÷ (AU$169m - AU$89m) (Based on the trailing twelve months to December 2023).
So, Metro Mining has an ROCE of 5.8%. In absolute terms, that's a low return and it also under-performs the Metals and Mining industry average of 11%.
See our latest analysis for Metro Mining
In the above chart we have measured Metro Mining's prior ROCE against its prior performance, but the future is arguably more important. If you'd like to see what analysts are forecasting going forward, you should check out our free analyst report for Metro Mining .
So How Is Metro Mining's ROCE Trending?
Metro Mining has not disappointed in regards to ROCE growth. The figures show that over the last five years, returns on capital have grown by 3,269%. That's not bad because this tells for every dollar invested (capital employed), the company is increasing the amount earned from that dollar. Interestingly, the business may be becoming more efficient because it's applying 53% less capital than it was five years ago. A business that's shrinking its asset base like this isn't usually typical of a soon to be multi-bagger company.
For the record though, there was a noticeable increase in the company's current liabilities over the period, so we would attribute some of the ROCE growth to that. Effectively this means that suppliers or short-term creditors are now funding 53% of the business, which is more than it was five years ago. Given it's pretty high ratio, we'd remind investors that having current liabilities at those levels can bring about some risks in certain businesses.
What We Can Learn From Metro Mining's ROCE
From what we've seen above, Metro Mining has managed to increase it's returns on capital all the while reducing it's capital base. Astute investors may have an opportunity here because the stock has declined 68% in the last five years. With that in mind, we believe the promising trends warrant this stock for further investigation.
On a separate note, we've found 2 warning signs for Metro Mining you'll probably want to know about.
If you want to search for solid companies with great earnings, check out this free list of companies with good balance sheets and impressive returns on equity.
Have feedback on this article? Concerned about the content? Get in touch with us directly. Alternatively, email editorial-team (at) simplywallst.com.
This article by Simply Wall St is general in nature. We provide commentary based on historical data and analyst forecasts only using an unbiased methodology and our articles are not intended to be financial advice. It does not constitute a recommendation to buy or sell any stock, and does not take account of your objectives, or your financial situation. We aim to bring you long-term focused analysis driven by fundamental data. Note that our analysis may not factor in the latest price-sensitive company announcements or qualitative material. Simply Wall St has no position in any stocks mentioned.
