
 Yahoo Finance
 MetLife, Inc. (NYSE:MET) Looks Just Right
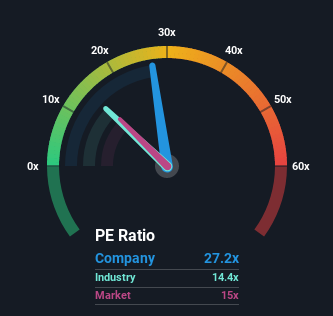
With a price-to-earnings (or "P/E") ratio of 27.2x MetLife, Inc. (NYSE:MET) may be sending very bearish signals at the moment, given that almost half of all companies in the United States have P/E ratios under 14x and even P/E's lower than 8x are not unusual. Although, it's not wise to just take the P/E at face value as there may be an explanation why it's so lofty.
MetLife could be doing better as its earnings have been going backwards lately while most other companies have been seeing positive earnings growth. It might be that many expect the dour earnings performance to recover substantially, which has kept the P/E from collapsing. If not, then existing shareholders may be extremely nervous about the viability of the share price.
View our latest analysis for MetLife
Want the full picture on analyst estimates for the company? Then our free report on MetLife will help you uncover what's on the horizon.
How Is MetLife's Growth Trending?
In order to justify its P/E ratio, MetLife would need to produce outstanding growth well in excess of the market.
Taking a look back first, the company's earnings per share growth last year wasn't something to get excited about as it posted a disappointing decline of 55%. This means it has also seen a slide in earnings over the longer-term as EPS is down 63% in total over the last three years. Accordingly, shareholders would have felt downbeat about the medium-term rates of earnings growth.
Looking ahead now, EPS is anticipated to climb by 47% per annum during the coming three years according to the twelve analysts following the company. That's shaping up to be materially higher than the 9.1% per year growth forecast for the broader market.
In light of this, it's understandable that MetLife's P/E sits above the majority of other companies. Apparently shareholders aren't keen to offload something that is potentially eyeing a more prosperous future.
The Final Word
It's argued the price-to-earnings ratio is an inferior measure of value within certain industries, but it can be a powerful business sentiment indicator.
We've established that MetLife maintains its high P/E on the strength of its forecast growth being higher than the wider market, as expected. Right now shareholders are comfortable with the P/E as they are quite confident future earnings aren't under threat. It's hard to see the share price falling strongly in the near future under these circumstances.
Before you settle on your opinion, we've discovered 2 warning signs for MetLife (1 is potentially serious!) that you should be aware of.
If you're unsure about the strength of MetLife's business, why not explore our interactive list of stocks with solid business fundamentals for some other companies you may have missed.
Have feedback on this article? Concerned about the content? Get in touch with us directly. Alternatively, email editorial-team (at) simplywallst.com.
This article by Simply Wall St is general in nature. We provide commentary based on historical data and analyst forecasts only using an unbiased methodology and our articles are not intended to be financial advice. It does not constitute a recommendation to buy or sell any stock, and does not take account of your objectives, or your financial situation. We aim to bring you long-term focused analysis driven by fundamental data. Note that our analysis may not factor in the latest price-sensitive company announcements or qualitative material. Simply Wall St has no position in any stocks mentioned.
Join A Paid User Research Session
You’ll receive a US$30 Amazon Gift card for 1 hour of your time while helping us build better investing tools for the individual investors like yourself. Sign up here
